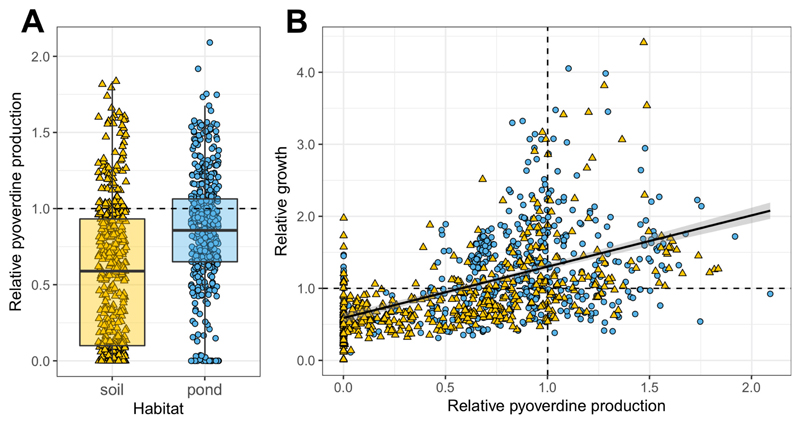
Figure 1. Environmental pseudomonads vary greatly in their level of pyoverdine production and ability to grow under iron-limited conditions.
(A) Our phenotypic screen involving 930 natural pseudomonads from 24 soil and 24 pond communities (n = 462 soil and n = 468 pond) revealed that soil isolates produce significantly less pyoverdine than pond isolates, and that there are significantly more non-producers in soil than in pond communities. (B) There is a positive correlation between the growth (optical density measured at 600 nm) of isolates and their pyoverdine production level, indicating that pyoverdine is important to cope with iron limitation. Pyoverdine production and growth were measured in iron-limited CAA medium, and scaled relative to the values of eight laboratory reference strains (Table S1). Values represent means across three replicates for soil (yellow triangles) and pond (blue circles) isolates. Dashed lines indicate pyoverdine production (horizontal line in A, vertical line in B) and growth (horizontal line in B) of the reference strains. The box plot shows the median (bold line), the 1st and 3rd quartile (box), and the 5th and 95th percentile (whiskers).

