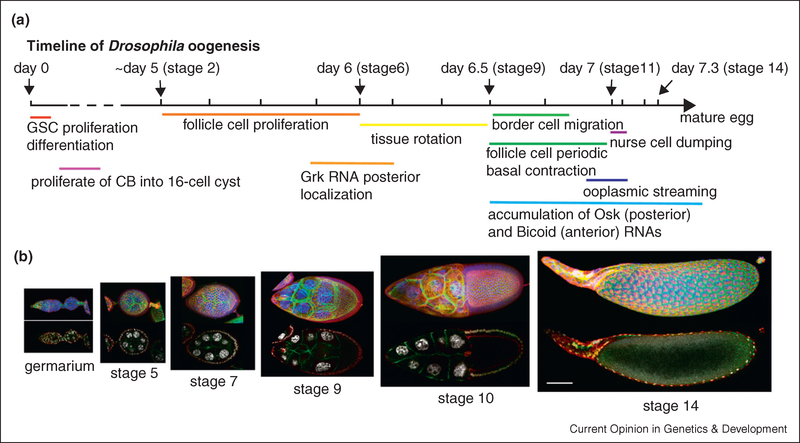
Figure 2.
(a) Timeline of Drosophila oogenesis with major developmental events labeled below. The beginning of each developmental stage is indicated by a mark on the line. The interval between stages was drawn in proportion to estimated development time. (b) Micrographs of major developmental stages of Drosophila oogenesis. Top panels show three-dimensional projections of z-stacks of confocal images with nuclei labeled in blue, E-cadherin labeled in green, and myosin labeled in red. Bottom panels show single-plane confocal images through the middle of the tissue with nuclei labeled in white, E-cadherin in green, and myosin in red. Scale bar is 50 μm.

