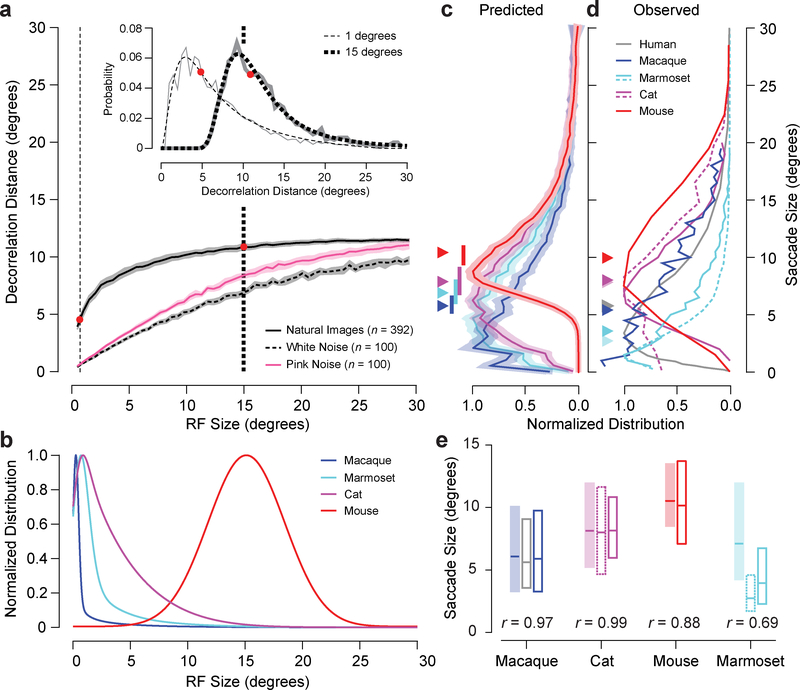
Figure 4.
Decorrelation distance and RF size predict saccade size. a, Median and 95% confidence interval of decorrelation distance versus RF size for natural, white noise, and pink noise images. The inset shows the entire distribution of decorrelation distances for two RF sizes indicated by the corresponding vertical dashed lines. Gray lines are individual probability measurements for each distance and the black lines are fits based on equation 18 in Online Methods. b, Distributions of RF sizes for macaques, marmosets, cats, and mice (see Online Methods for details). c, RF sizes were transformed into decorrelation distances or predicted saccade sizes using the data represented in a. The mean and shaded bootstrapped 95% confidence band represent the distribution of all predicted saccade sizes. Each set of data was resampled 1000 times allowing repeats to produce surrogate datasets of the same size. Median predicted saccade sizes are indicated by a triangle. A correspondingly coloured vertical bar represents the range of median predicted saccade sizes when using RFs that are halved to doubled in size. d, Observed saccade sizes for humans and macaques, cats, mice, and marmosets (dashed versus solid lines represent different sets of data: see Online Methods for details). Median observed saccade sizes are indicated by triangles. e, Comparison of predicted (shaded) and observed (white) saccade size box plots of distributions (range: 25th and 75th quartiles, centre: median). Solid and dashed outlined boxes correspond to solid and dashed lines in d. The correlation between the entire predicted and average observed saccade size distributions is displayed at the bottom of each set of box plots.

