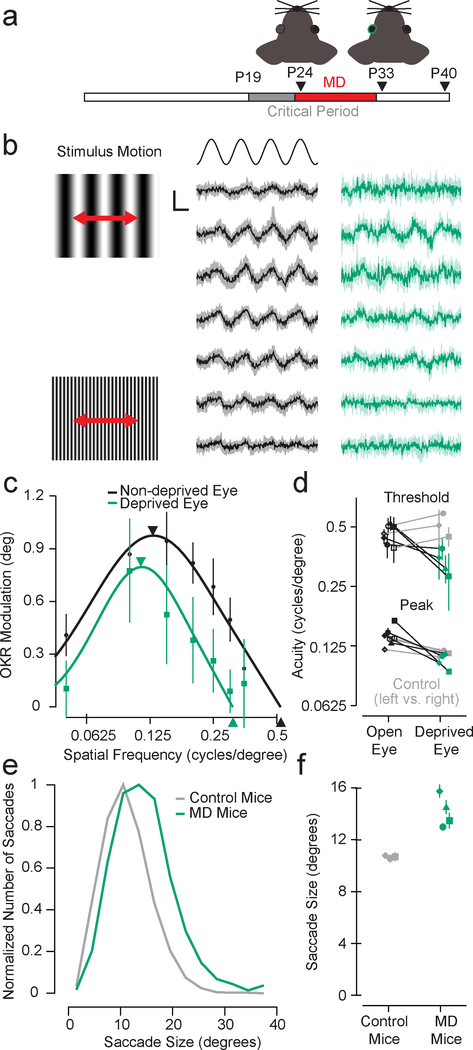
Figure 6.
Decreasing acuity with monocular deprivation (MD) increases saccade sizes. a, Timeline of monocular deprivation (P24-P33) and acuity and saccade measurements (P40). b, A sinusoidal luminance grating (left) was moved back and forth horizontally ±6° at 0.5 Hz to induce an optokinetic reflex (OKR). The eye movements for an example mouse at varying spatial frequencies (low-to-high for top-to-bottom) are shown for the non-deprived (black) and deprived (green) eyes. Shaded error bands are 95% confidence intervals of the median (n = 20 stimulus repeats for all mice). Vertical scale bar is 2° and horizontal scale bar is 0.5 s. c, Corresponding OKR modulation varies as a function of spatial frequency. The peak spatial frequency and high spatial frequency threshold are lower for the deprived versus non-deprived eye. Arrows are median peak and threshold estimates. Error bars are 95% confidence intervals of the median. d, This reduction in acuity was consistent across four mice (see also Fig. S7a). Three control mice (grey) had similar acuity for both eyes that matched the acuity of the non-deprived eye of the MD mice. Error bars are standard error of the median. e, Saccade sizes were larger for MD mice versus control mice (MD: median = 13.91°, n = 1448 saccades, bootstrapped 95% confidence interval = [13.46, 14.37]; control: median = 10.73°, n = 1586 saccades, bootstrapped 95% confidence interval = [10.52, 10.94]). f, This was consistent for all MD mice (n = 668, 256, 226, and 298 saccades) compared to all control mice (n = 896, 344, and 346 saccades). Each data point is the median and error bars are standard error of the median.

