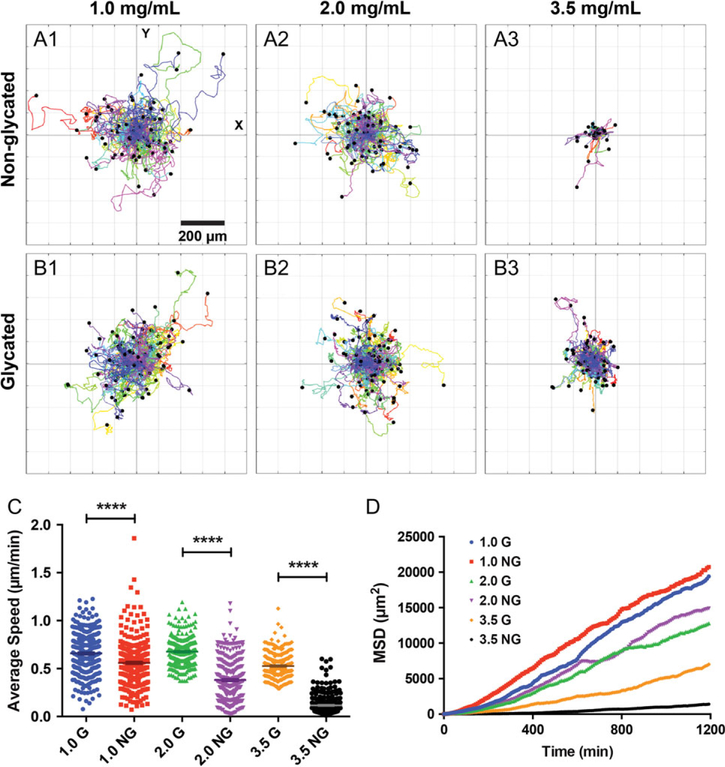
Figure 2.
Collagen glycation modulates single tumor cell invasion. (A–B) Polar plots of cell trajectories in non-glycated (A1–3) and glycated (B1–3) collagen at a concentration of 1.0, 2.0, and 3.5 mg/mL. Each colored line represents one cell track, and each track is 20 h long and taken at 8 min time interval. The first data point of each track is centered at (0,0) for comparison purposes. There are 100 cell tracks in each plot. (C) The average speed of MDA-MB-231 cells in glycated and non-glycated collagen. **** represents p-value < 0.0001. The average speed of the MDA-MB-231 cells in non-glycated 1.0, 2.0, and 3.5 mg/mL collagen are 0.56 ± 0.01, 0.38 ± 0.01, and 0.66 ± 0.01, 0.68 ± 0.01, and 0.12 ± 0.01 μm/min, respectively. The average speed of the MDA-MB-231 cells in glycated 1.0, 2.0, and 3.5 mg/mL collagen are 0.53 ± 0.01 μm/min, respectively. A total of 300 cell tracks from three repetitive experiments were used to compute the average speed. D. Mean square displacement of MDA-MB-231 cells in 1.0, 2.0, and 3.5 mg/mL glycated (G) and non-glycated (NG) gels. The MSD was computed using 300 cell tracks from three repetitive experiments.

