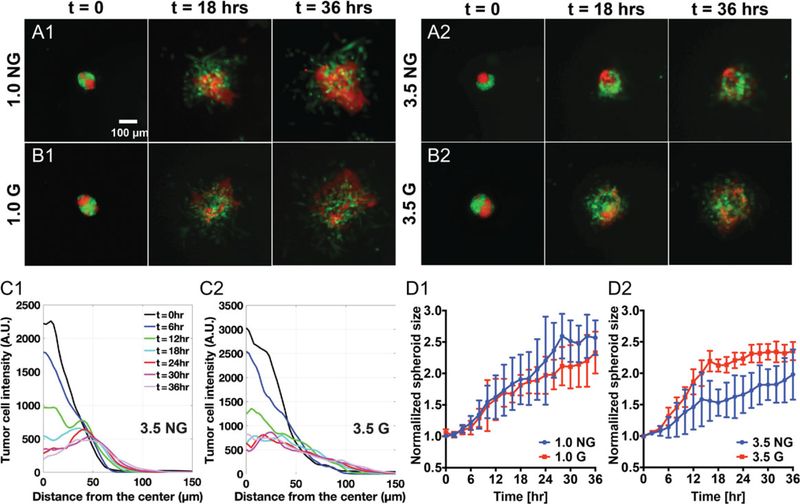
Figure 3.
Collagen glycation modulates tumor spheroid invasion. (A and B) Time sequence fluorescence images of co-culture spheroids embedded in non-glycated (A1, A2) and glycated (B1, B2) collagen matrices with concentrations of 1.0 mg/mL and 3.5 mg/mL. Images shown are at time points 0, 18, and 36 h. Here, t = 0 is defined as about 2 h after spheroids were introduced into the collagen matrices. The co-culture spheroid consists of MCF-10A cells (red) and MDA-MB-231 cells (green), with a cell number ratio of 1:1. (C) Time evolution of radial MDA-MB-231 cell density distribution in 3.5 mg/mL non-glycated (C1) and 3.5 mg/mL glycated (C2) collagen matrices. (D) Time evolution of normalized spheroid size for MDA-MB-231 cells in glycated collagen matrices than in non-glycated collagen matrices with collagen concentration of 1.0 mg/mL (D1) and 3.5 mg/mL (D2). Each error bar is computed from N = 2 to 3 spheroids.

