
Figure 3.
OTC reduces infarct volume and promotes functional recovery after MCAO
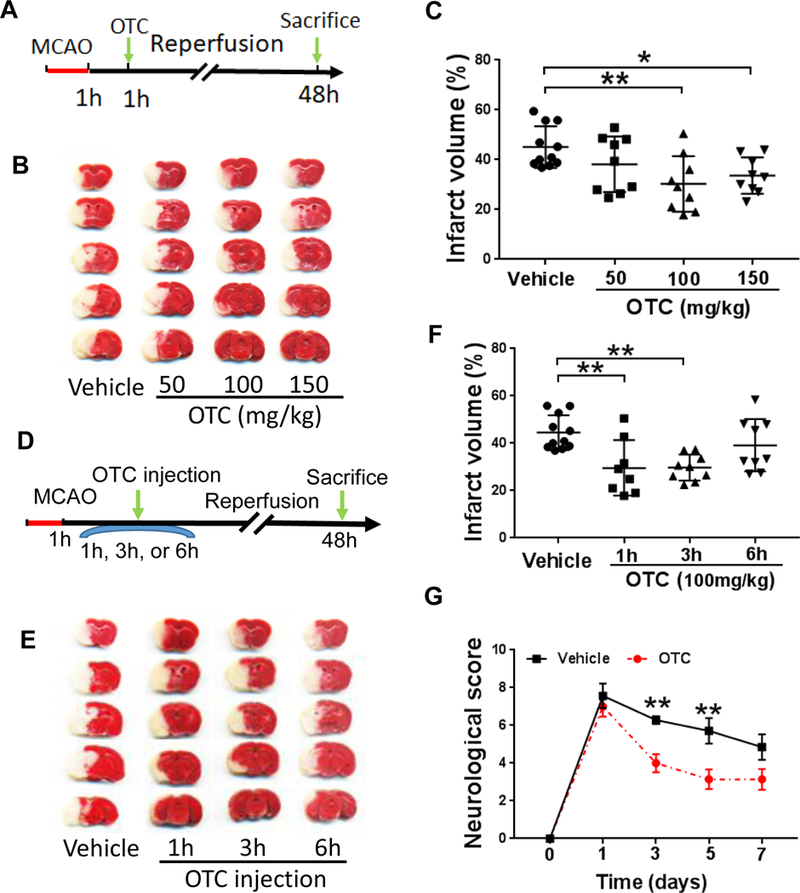
A. Diagram of the experimental design. OTC (50,100 or 150 mg/kg) was administered via the tail vein injection at 1 hour after reperfusion. Animals were sacrificed at 48 hours after ischemia and the brains were then isolated for TTC staining.
B. TTC staining of mouse brains after MCAO.
C. Quantitative analysis of TTC staining of mouse brains. Data are shown as mean ± SD. N = 9 mice for each OTC treated group; n = 11 for the vehicle treated group. p = 0.0090, F(3, 34) = 4.517, one-way ANOVA with Tukey’s multiple-comparison test: p Vehicle vs otc (100mg/kg) = 0.0043, p Vehicle vs OTC (150mg/kg) = 0.0304.
D. Diagram of the experimental design. OTC (100 mg/kg) was administered via the tail vein injection at 1 hour, 3 hours or 6 hours after ischemia. Animals were sacrificed at 48 hours and brains were then isolated for TTC staining.
E. Representative images of TTC-stained mouse brains post-treated with 1GG mg/kg OTC or vehicle at different time points respectively.
F. Quantitative analysis of infarct volume of the mice brain. (n = 9 mice per condition, except for mice treated with vehicle for which n = 11 and those treated with OTC n = B). p = 0.0017, F(3, 33) = 6.314, one-way ANOVA with Tukey’s multiple-comparison test: p Vehicle vs 1 hour injection = 0.0065, p Vehicle vs 3 hours injection) = 0.0052.
G. Behavior test of mice after MCAO. OTC-treated mice show better neurobehavioral performance than the vehicle-treated mice. Data are shown as mean ± SEM, n = 7 for each group; p = G.G536, F(4, 60) = 2.477, two-way ANOVA with Sidak’s multiple-comparison test. For day 3, p Vehicle vs OTC = 0.0094, day 5, p Vehicle vs OTC = 0.0027. **p < 0.01.