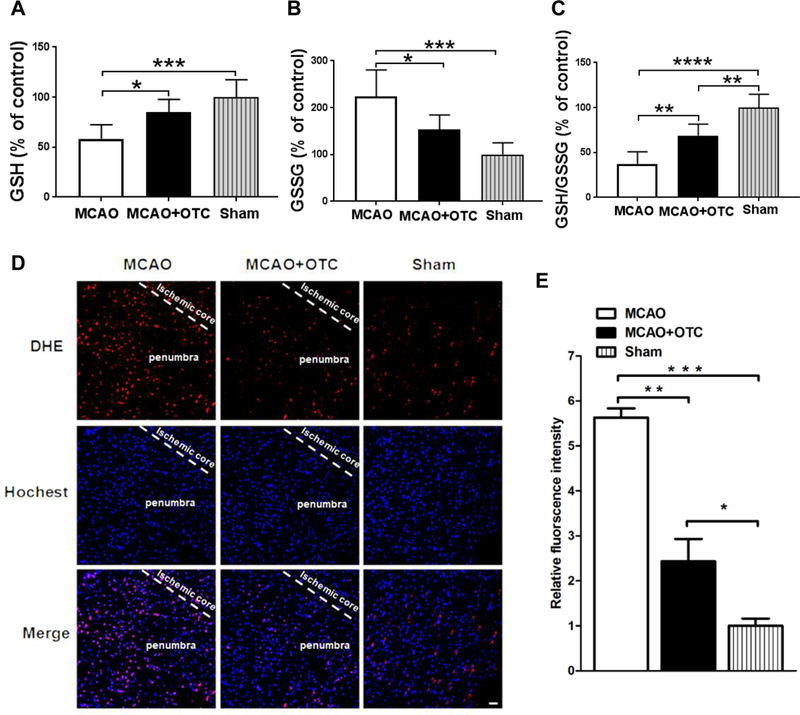
Figure 4.

OTC treatment decreased the production of superoxide fluorescence and enhanced GSH antioxidant system in the penumbral cortex after I/R
A. GSH levels were significantly decreased in the penumbral cortex 24 h after ischemic stroke. OTC treatment restored depleted GSH levels. Data are expressed as percentage of control (sham); n = 6 per group. p = 0.0008, F(2, 15) = 11.83, one-way ANOVA with Tukey’s multiple-comparison test: p MCAO vs MCAO + OTC = 0.0208, p MCAO vs sham = 0.0006. Bar heights represent mean. Error bars indicate SD.
B. Elevated GSSG levels were antagonized by OTC treatment. Data are expressed as percentage of control (sham). N = 6, p = 0.0003, F(2, 15) = 14.47, one-way ANOVA with Tukey’s multiple-comparison test: p MCAO vs MCAO + OTC = 0.0215, p MACO vs sham = 0.0002. Bar heights represent mean. Error bars indicate SD.
C. The GSH/GSSG ratio was significantly reduced following MCAO, whereas OTC administration ameliorated the reduction. Data are expressed as percentage of control (sham). n = 6, p <0.0001, F(2, 15) = 31.62, one-way ANOVA with Tukey’s multiple-comparison test: p MCAO vs MCAO + OTC = 0.0031, p MCAO vs sham < 0.0001, p MCAO + OTC vs Sham = G.GG35. Bar heights represent mean. Error bars indicate SD.
D. Fluorescence micrographs of the brain slice in sham, vehicle and OTC groups. Scale bar, 20 μm.
E. Semi-quantitation of DHE fluorescence intensity. Data are expressed as relative fluorescence intensity to sham mice. n = 3, p = 0.0001, F(2, 6) = 53.96, one-way ANOVA with Tukey’s multiple-comparison test: p MCAO vs MCAO + OTC = 0.0010, p MCAO vs sham = 0.0001, p MCAO + OTC vs Sham = 0.0455. Bar heights represent mean. Error bars indicate SD.
