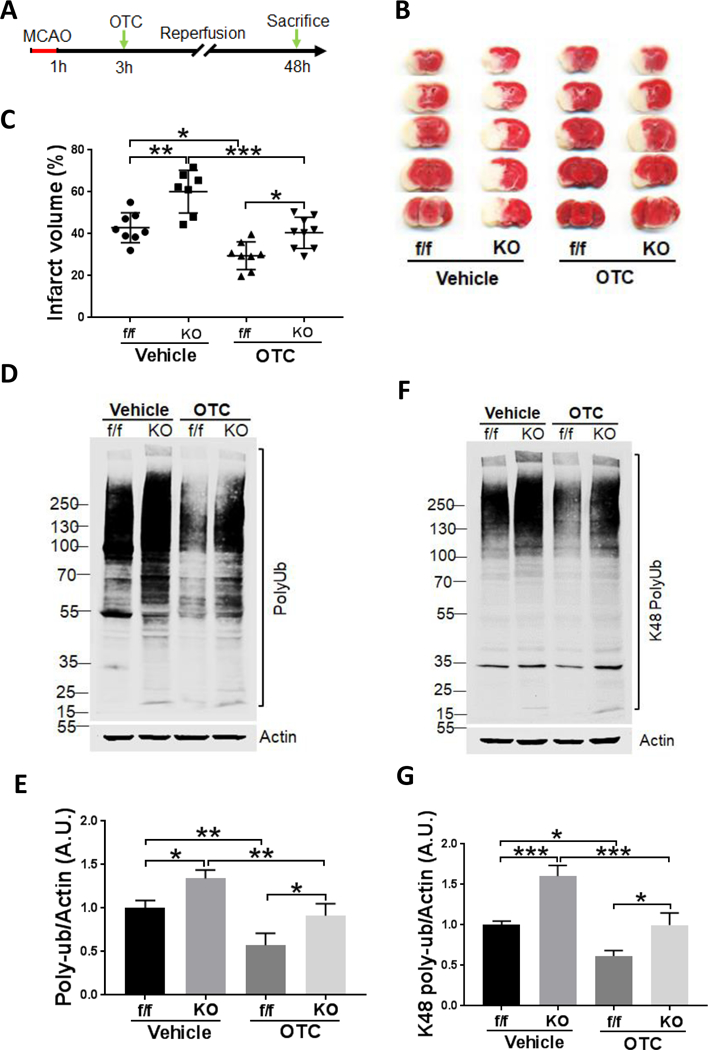
Figure 6.

OTC-mediated neuroprotection in mouse brain at least partially relies on Ubqln1 expression
A. Schematic procedure for MCAO and administration of OTC in the Ubqln1 KO and floxed control (f/f) mice.
B. TTC staining of mice brain.
C. Quantitative analysis of brain infarct area. N = 8 mice per condition (except for KO mice treated with vehicle, n = 7, and the KO mice treated with OTC, n = 9). p < 0.0001, F(3, 28) = 19.17, one-way ANOVA with Tukey’s multiple-comparison test: p f/f (Vehicle) vs KO (Vehicle) = 0.0012, p f/f (Vehicle) vs f/f (OTC) = 0.0105, p KO (Vehicle) vs KO (OTC) = 0.0002, p f/f (OTC) vs KO (OTC) = 0.0374. Data are shown as mean ± SD.
D. Western blot analysis of polyUb protein levels in KO and non-KO (floxed, f/f) mice following I/R and OTC treatments.
E. Quantitation of polyUb protein levels shown in (D). Data are expressed as fold change relative to vehicle-treated f/f mice after normalization to actin. p = 0.0003, F(3, 8) = 21.48, one-way ANOVA with Tukey’s multiple-comparison test: p f/f (Vehicle) vs KO (Vehicle) = 0.0310, p f/f (Vehicle) vs f/f (OTC) = 0.0095, p KO (Vehicle) vs KO (OTC) = 0.0090, p f/f (OTC) vs KO (OTC) = 0.0325. Data are shown as mean ± SD.
F. Western blot analysis of K48-linked polyUb protein levels in KO and non-KO (floxed, f/f) mice following I/R and OTC treatments.
G. Quantitation of K48-linked polyUb protein levels shown in (F). Data are expressed as fold change relative to vehicle-treated f/f mice after normalization to actin. p < 0.0001, F(3, 8) = 43.18, one-way ANOVA with Tukey’s multiple-comparison test: p f/f (Vehicle) vs KO (Vehicle) = 0.0006, p f/f (Vehicle) vs f/f (OTC) = 0.0102, p KO (Vehicle) vs KO (OTC) = 0.0006, p f/f (OTC) vs KO (OTC) = 0.0102. Data are shown as mean ± SD.
