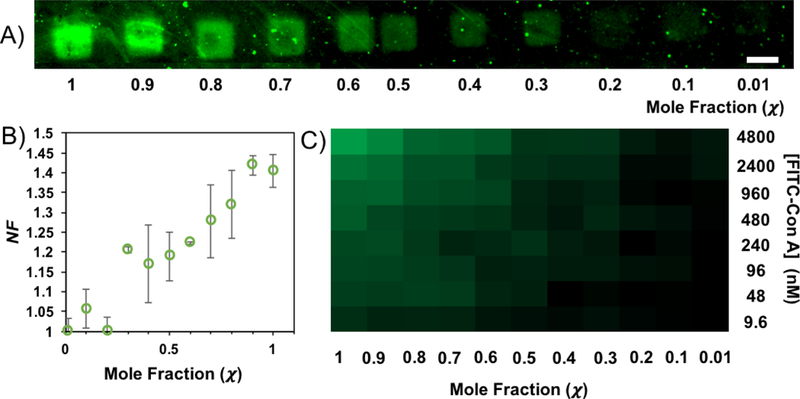
Figure 2.

A) Fluorescence image of the printed features of α-Man following exposure to ConA concentration at 240 nM shows a decrease in NF as mole fraction, χ, decreases. The scale bar is 45 μm. B) Data showing the decrease of NF as the χ of glycan decreases in each feature. The error bars are one standard deviation from the mean. C) A heat map representing binding at all glycan χ and ConA concentrations.
