Figure 3.

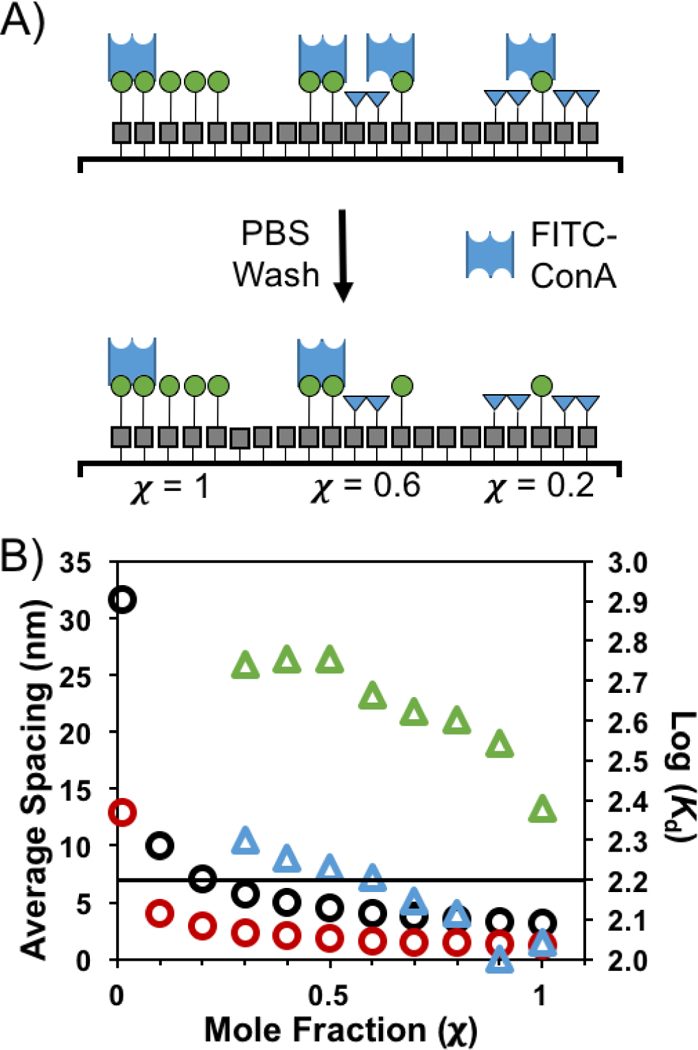
A) Model demonstrating how reducing χ decreases ConA recognition. As the number of glycans on the surface decreases, the average spacing between glycans becomes larger than the distance between ConA binding sites. This resulting monovalent binding is not sufficiently strong to survive washing. B) The estimated average spacing between mannosides as a function of χ are represented by the circles. The black circles assume a molecular packing of 0.1 molecules·nm–2, and the red circles represent changes in spacing assuming a molecular packing of 0.6 molecules·nm–2. The triangles are the log(Kd) values from Table 1 for [ConA] of 960 nM (green) and 240 nM (blue). The black line corresponds to an average spacing of 7 nm, which is the distance between glycan-binding pockets in tetrameric ConA.
