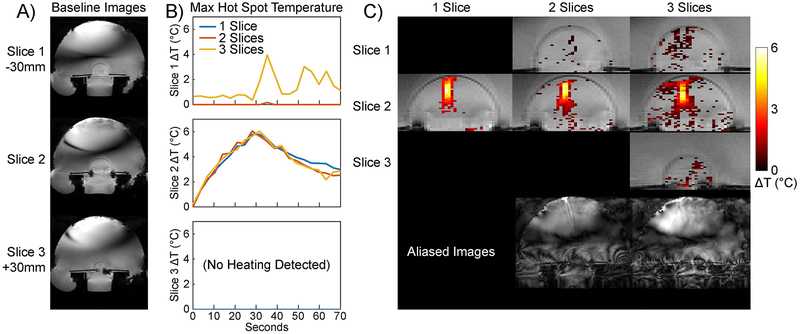
Figure 9:
Sagittal phantom heating. (A) Baseline images for each slice. The slices were separated by 30 mm with Slice 2 centered on the focus. (B) Plots of maximum hot spot temperature versus time for each slice, in a 2 × 11 voxel ROI centered on the hot spot in Slice 2 and applied in the same position to all three slices. (C) Temperature maps in each slice at peak heat (30 seconds). Temperature rises above 0.1 °C are overlaid on baseline images that are cropped to the phantom. Supporting Information Video S4 shows temperature maps at each time point. Full-FOV slice-aliased images at this time point are shown in the bottom row for the two- and three-slice acquisitions.

