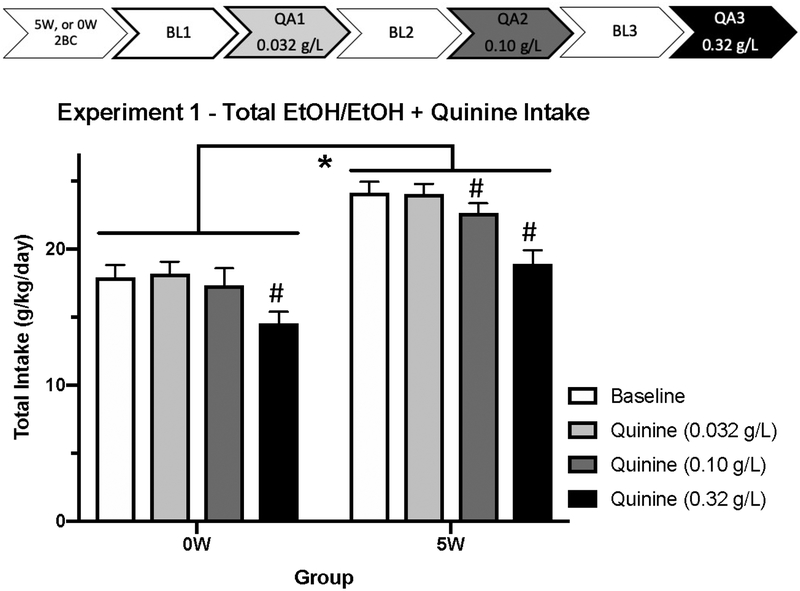
Figure 1:
Experiment 1 alcohol intake (g/kg) during Baseline (10% 2BC) and Quinine-Adulteration tests (0.032 – 0.32 g/L quinine). Overall, animals with 5 weeks of drinking experience (5W) drank more than animals with one day of experience (0W; * indicates p < 0.05 for 5W compared to 0W, ns = 17 – 18 per history group), but groups did not differ in sensitivity to quinine at these concentrations. # indicates that quinine suppressed alcohol intake relative to the quinine-free baseline test, p < 0.05

