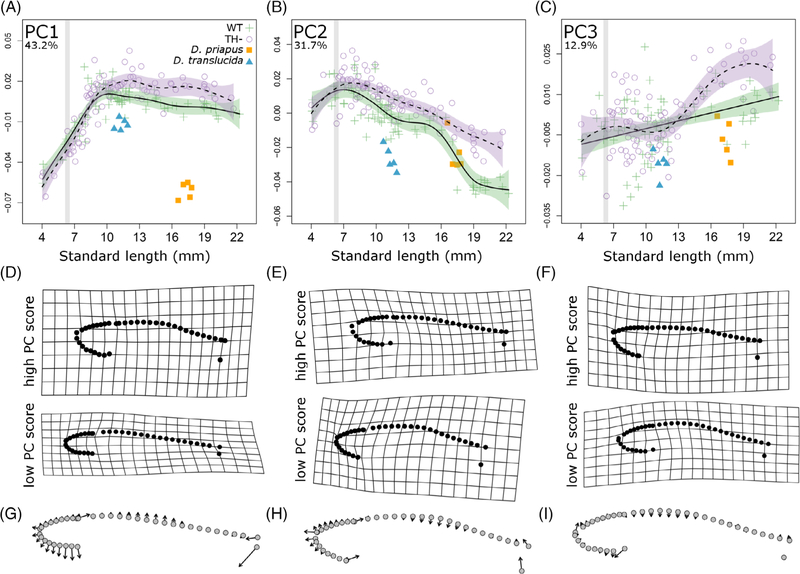
FIGURE 7.
Danionella adults resemble larval zebrafish but not TH− zebrafish. A-C, Principle component (PC) scores of body shape plotted against standard length for both WT (green cross) and TH− (purple open circle) zebrafish, compared to Danionella priapus (orange square) and Danionella translucida (blue triangle) adults. Percent variation explained by each PC axis is shown on the upper left corner. Developmental trajectory is shown in solid line with purple SE for WT zebrafish and dashed line with green SE for TH− zebrafish. For comparison between graphs, gray stripes highlight period from 6 to 6.4 SL, during which TH availability is elevated. D-F, Deformation grids showing extreme shapes along each PC. G-I, Vector plots showing shape change along each PC axis, with arrows pointing from negative to positive PC values. SL, standard length; TH−, hypothyroid; WT, Wild-type

