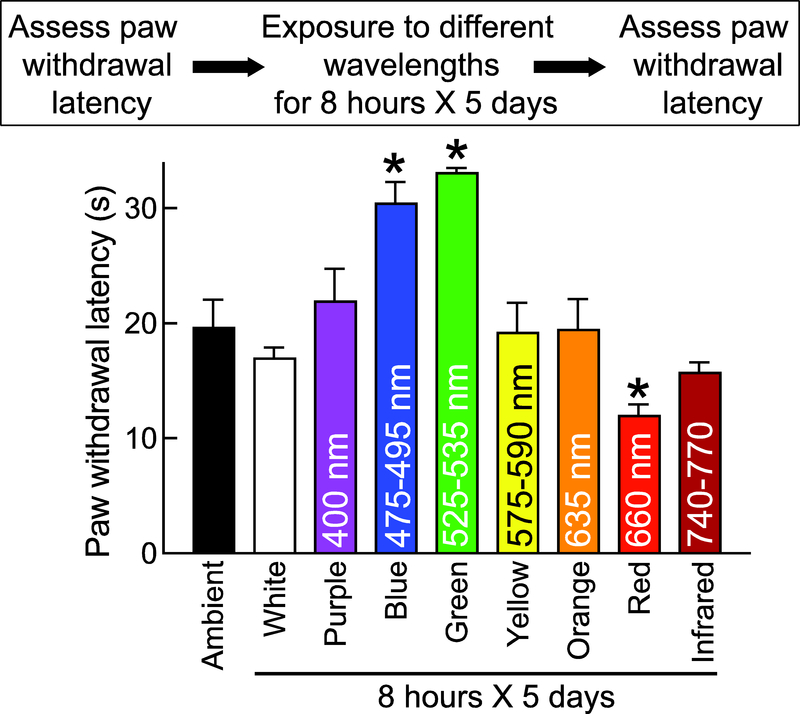
Figure 1. Effect of exposure to different colors on naïve rats’ paw withdrawal latency.
Bar graph of PWL (in seconds) of male rats (n=5–6 per group) exposed to the indicated spectrum of light (wavelength in nanometers listed within bars) for 8 hours daily for 5 days. (*p<0.05, compared to baseline (BL; pre-LED exposure), Kruskal-Wallis test, n=6. In all figures, the experimental timeline and paradigm are shown above the graphs.

