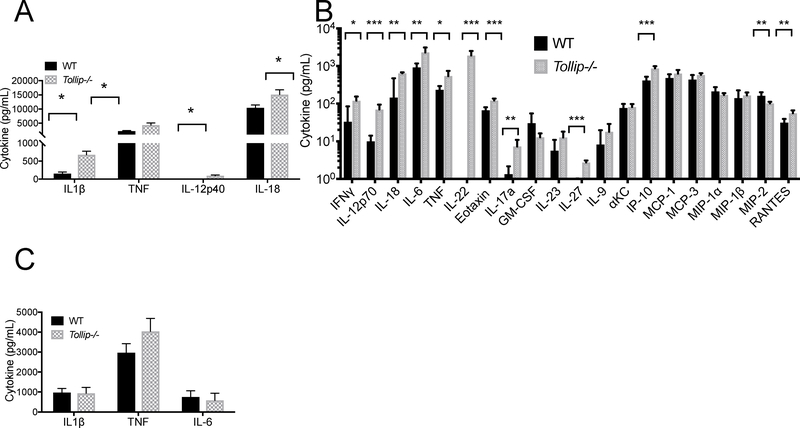
Figure 2. Cytokine Responses from WT and Tollip−/− mice after L. pneumophila (Lp) aerosol infection.
Mice were infected with 106 CFU WT Lp Philadelphia-1 strain and after 24 hours, cytokine concentrations were measured from bronchoalveolar (BAL) fluid and serum. A) BAL cytokine concentrations measured by ELISA from WT and Tollip−/− mice. * p < 0.05, Student’s two-sided t-test. B) BAL cytokines, measured by Luminex cytokine assay 24 hours after Lp aerosol infection. * p < 0.05, ** p < 0.01, *** p < 0.001, at 1% false discovery rate. Error bars represent +/− SEM. C) Serum cytokine concentrations measured by ELISA. * p < 0.05, Student’s two-sided t-test. Error bars represent +/− SEM. Data are representative of three independent experiments with N = 5 in each group.

