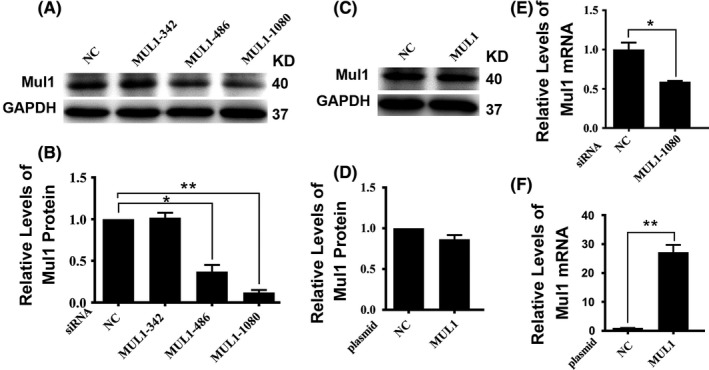
Figure 3.

Expression of mitochondrial E3 ubiquitin ligase 1 (Mul1) in engineered 769‐P cells. (A‐D) Representative immunoblot results (A,C) and their respective quantification (B,D) showing levels of Mul1 protein in control cells (NC) and stable cell lines transfected with different Mul1‐specific siRNAs (A,B) or control cells (NC) and stable cell lines transfected with Mul1 expressing plasmid (C,D). (E,F) Plots showing a comparison of levels of Mul1 mRNA between control (NC) and stable cell line with siRNA 1080 (E) and between control (NC) and stable cell line with Mul1 plasmid (F). *P ≤ .05; and **P ≤ .01
