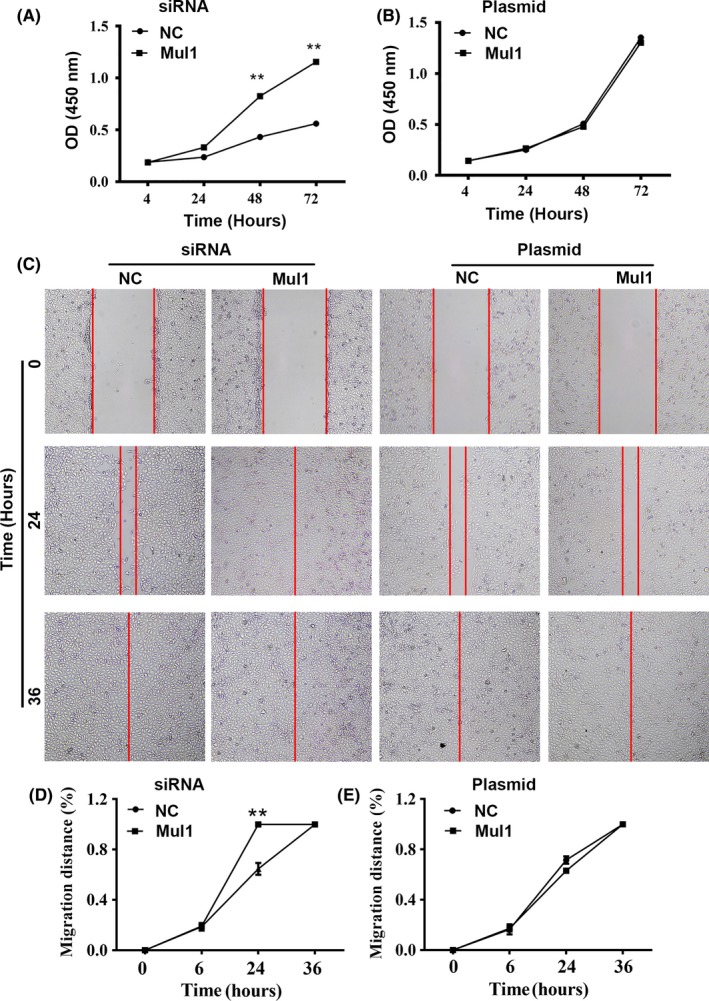
Figure 4.

Impact of mitochondrial E3 ubiquitin ligase 1 (Mul1) on growth and migration of clear cell renal cell carcinoma (ccRCC) cells. (A,B) Plots showing a comparison of growth rates between control (NC) and cells with Mul1‐specific siRNA (A) or between control (NC) and cells with Mul1 plasmid (B). (C‐E) Representative images (C) and plots (D,E) showing a comparison of migration distances between cells as stated in A (D) or B (E). **P ≤ .01
