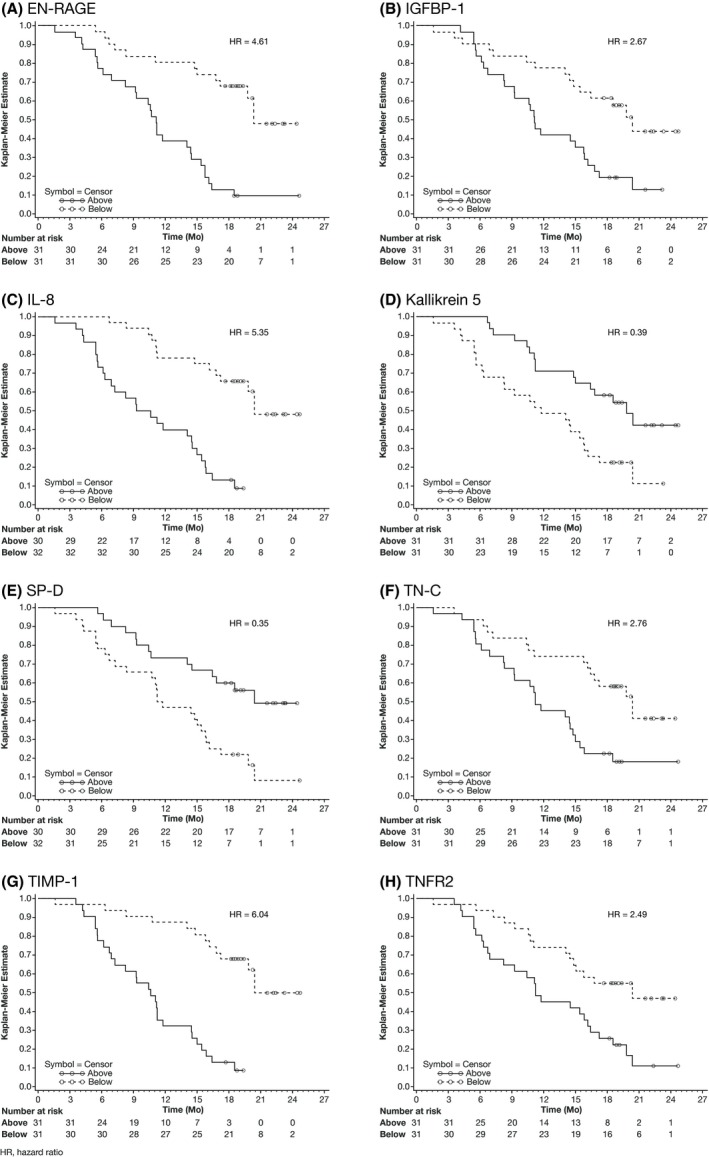
Figure 3.

Kaplan‐Meier curves of overall survival (OS) stratified by median plasma concentration at baseline for eight biomarkers: (A) advanced glycation end‐products binding protein (EN‐RAGE), (B) insulin‐like growth factor‐binding protein 1 (IGFBP‐1), (C) interleukin‐8 (IL‐8), (D) kallikrein 5, (E) pulmonary surfactant‐associated protein D (SP‐D), (F) tenascin‐C (TN‐C), (G) tissue inhibitor of metalloproteinases 1 (TIMP‐1), and (H) tumor necrosis factor receptor 2 (TNFR2)
