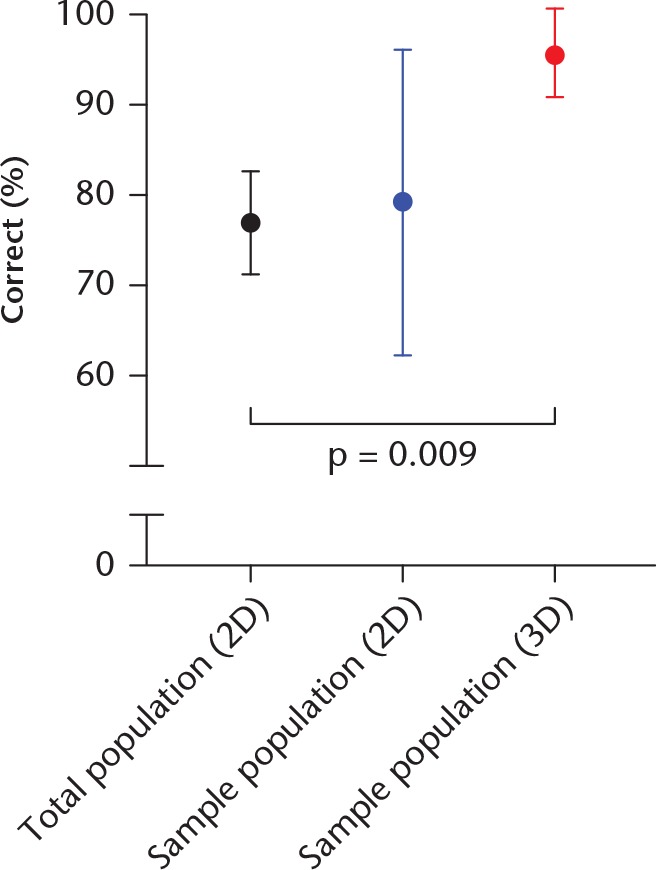
Fig. 2.

Chart showing the results of the classification of the bone involvement variable using a 3D web-based picture archiving and communication system (webPACS) system, as performed in clinical practice, versus using a screenshot of the images alone (2D group). The sample population demonstrated a significant improvement when completing the 3D analysis compared with both the total interuser population who completed the 2D analysis (95.7% (95% confidence interval (CI) 90.8 to 100.0) vs 77.0% (95% CI 71.2 to 82.8); p = 0.009, analysis of variance with Dunnett’s post hoc test and the sample population when completing the 2D analysis (79.3% (95% CI 62.3 to 96.3); p = 0.028, Student’s t-test).
