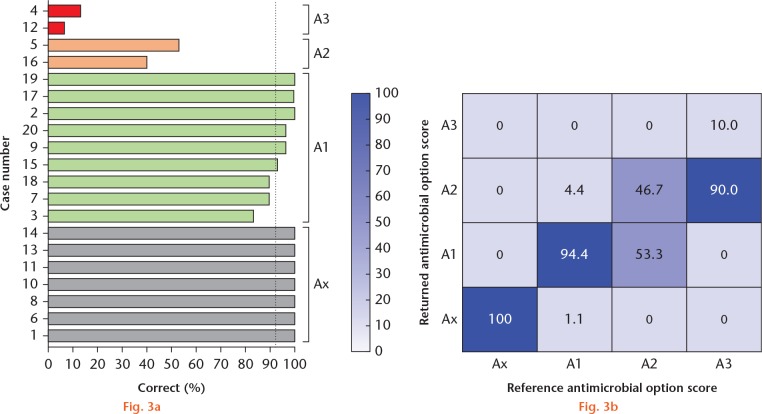
Fig. 3.
Results for the antimicrobial options variable in the interuser assessment. a) Bar chart showing the individual answers in each of the cases for the antimicrobial options variable, organized by the reference score. The dotted line is the mean score for the antimicrobial options category (92.2%). b) Heat map demonstrating the returned antimicrobial options score versus the reference antimicrobial options score.

