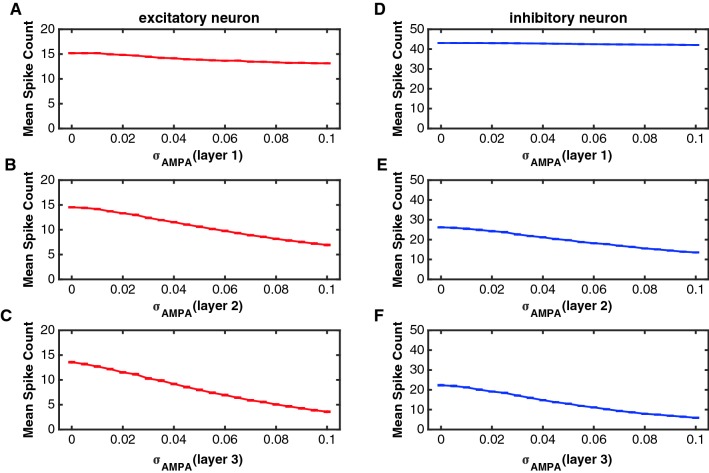
Fig. 3.
The relation between and the spike count (spike number in 400 ms) of excitatory and inhibitory neurons in the three layers. In this simulation, the value of was set zero (there was no noise in NMDA receptors). To simulate results in one layer, the value of changed from 0 to 0.1 in that layer, but was kept a constant value in the other two layers ( = 0.08). a–c The function of the mean spike count against for excitatory neurons in layer 1 (a), layer 2 (b) and layer 3 (c), respectively. d–f The function of the mean spike count against for inhibitory neurons in layer 1 (d), layer 2 (e) and layer 3 (f), respectively. The red curves indicate the excitatory neurons and the blue curves represent the inhibitory neurons. Error bars indicate s.e.m. The values of s.e.m. are very small in the figures

