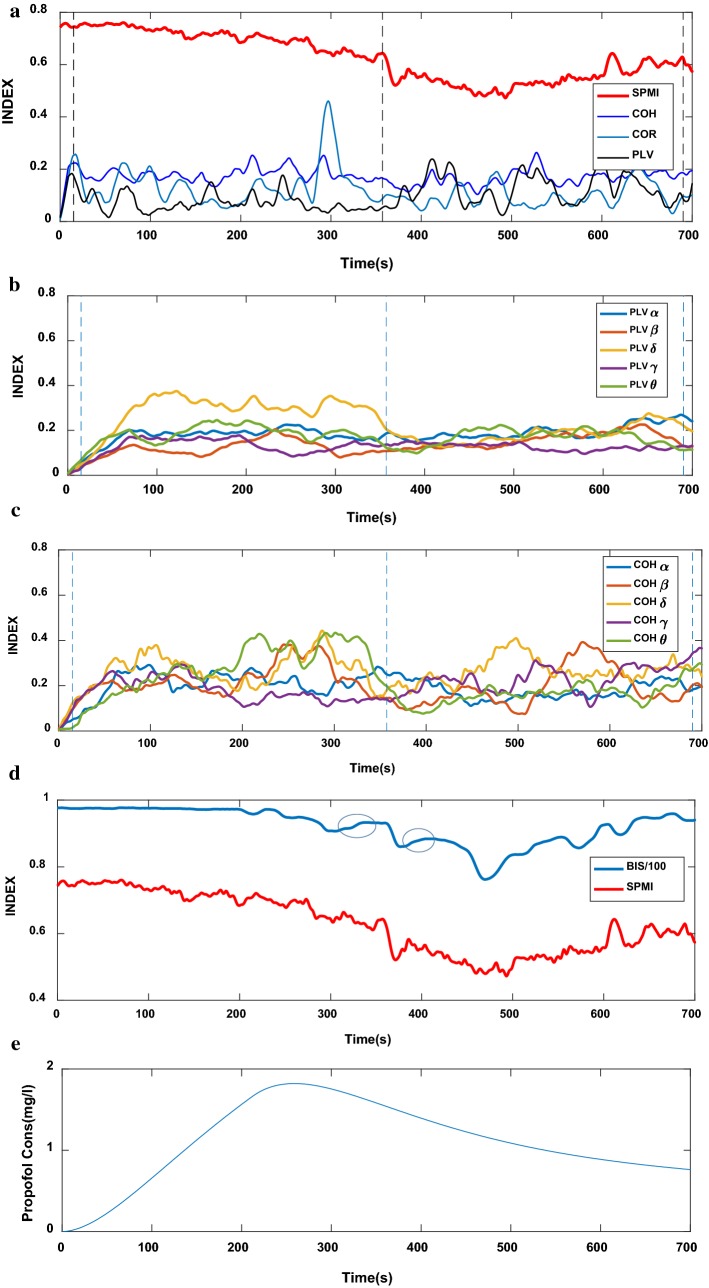
Fig. 2.
An example of the changes with time for the EEG measures for one subject (a–d) and simultaneously the propofol effect site concentration Ceff (e). a The functional connectivity indexes between two-channel EEG signals using SPMI, COR, COH (all frequency bands) and PLV (all frequency bands). Three dashed vertical lines from the left to the right show times of baseline (wakefulness), loss of consciousness (LOC) and recovery, respectively. b, c The functional connectivity indexes between two-channel EEG signals using COH and PLV for the five frequency bands: Delta δ, Theta θ, Alpha α, Beta β and Gamma γ. d The functional connectivity indexes between two-channel EEG signals using SPMI and simultaneously the corresponding BIS. e simultaneously the propofol effect site concentration Ceff. The irregular rises of BIS index are identified in (d) with a circle

