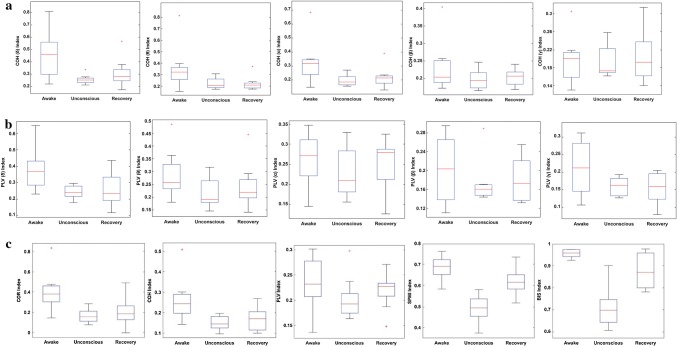
Fig. 4.
Box plots of EEG-derived functional connectivity indexes in different anesthetic states for all subjects. a, b COH and PLV in five frequency bands: Delta δ, Theta θ, Alpha α, Beta β and Gamma γ. c COR, COH (all frequency bands), PLV (all frequency bands), SPMI, and BIS index. The coefficient of variation (SD/mean) in SPMI index (0.122) is smaller than BIS index (0.131) at the unconscious state

