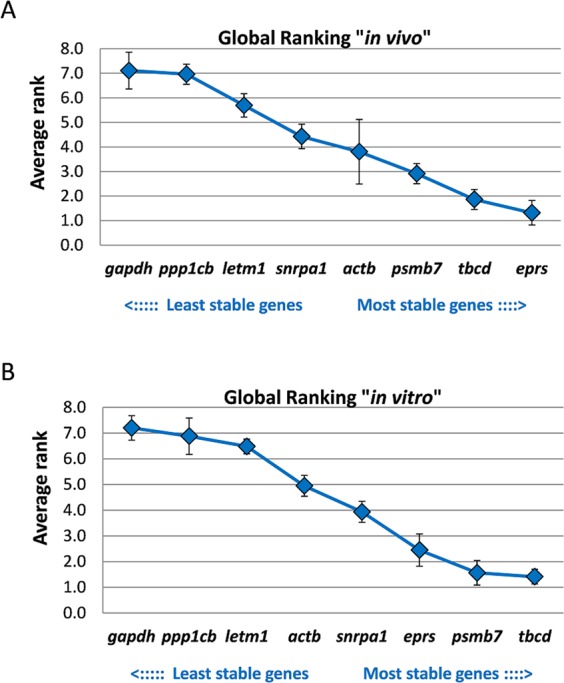
Figure 5.

Mean rank of expression stability of eight candidate reference genes in F. hepatica. A number (from 1 to 8) was assigned to each stability coefficient obtained from four algorithms. The mean rank with SEM is shown for (A) the analysis of three intra-mammalian stages (NEJs, immature and adult flukes), and (B) the analysis of in vitro-cultured juveniles (NEJs before and after 28 days culture). Genes were ranked from the least stable (on the left) to the most stable (on the right).
