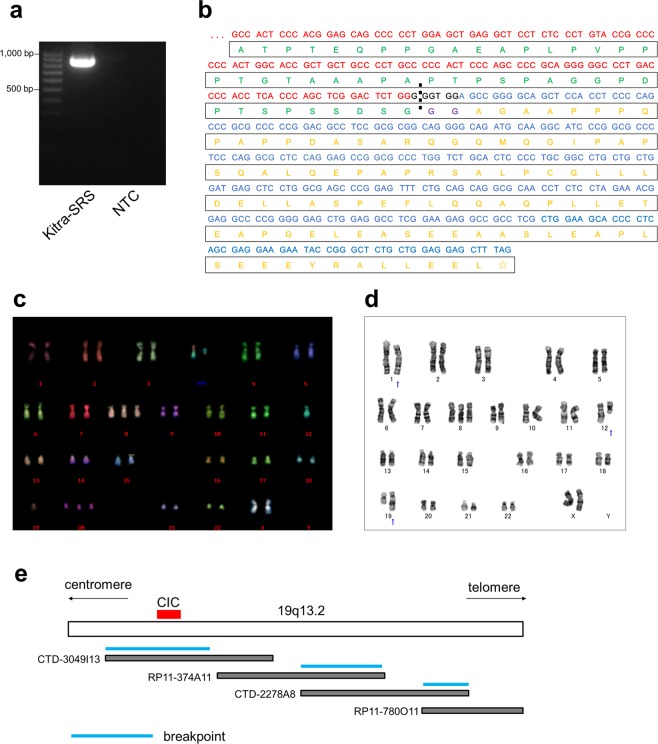
Figure 3.
Genetic analysis of Kitra-SRS cells. (a) RT-PCR with the CIC forward primer located in exon 16 and the DUX4 reverse primer in exon 1. No band is present for the negative control (NTC) of distilled water in lane 3. (b) Nucleotide and predicted amino acid sequences of the CIC-DUX4 fusions. Two additional amino acid residues that do not come from either CIC or DUX4 are present at the fusion point. Red indicates the CIC nucleotide sequence; blue, DUX4 nucleotide sequence; black, nucleotide sequence not belonging to CIC or DUX4; green, CIC amino acid sequence; yellow, DUX4 amino acid sequence; purple, amino acid sequence not belonging to CIC or DUX4. (c) A representative karyotype of Kitra-SRS cells at passage 20. M-FISH analysis showed four recurrent structural chromosomal rearrangements: 48, XX, del(1)(p32), +8, t(12;19) (q13;q13), +20. (d) A representative karyotype of Kitra-SRS cells at passage 100. G-banding showed four recurrent structural chromosomal rearrangements: 47, XX, del(1)(p?), +8, der(12)add(12)(p13)t(12;19) (q13;q13.1), der(19) t(12;19) (q13;q13.1). (e) A physical map of 19q13.2 and bacterial artificial chromosome clones used for identification of breakpoints.

