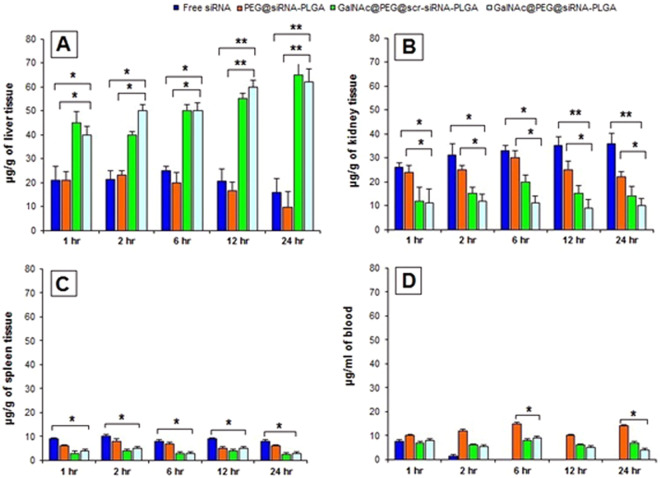
Figure 5.
In vivo Biodistribution of GalNAc@PEG@siRNA-PLGA. The mice were injected intravenously at a single dose of free siRNA, PEG@siRNA-PLGA, GalNAc@PEG@scr-siRNA-PLGA and GalNAc@PEG@siRNA-PLGA. siRNA concentration was determined at 1 h, 2 h, 6 h, 12 h and 24 h time points in Liver (A), Kidney (B), Spleen (C) and Blood (D). Data are the means ± SD of three sets of different experiments. Statistical analysis was compared by one-way ANOVA followed by Dunnett’s post hoc test. *P < 0.05, **P < 0.01 for NC versus Free siRNA; *P < 0.05, **P < 0.01 for NC versus PEG@siRNA-PLGA.

