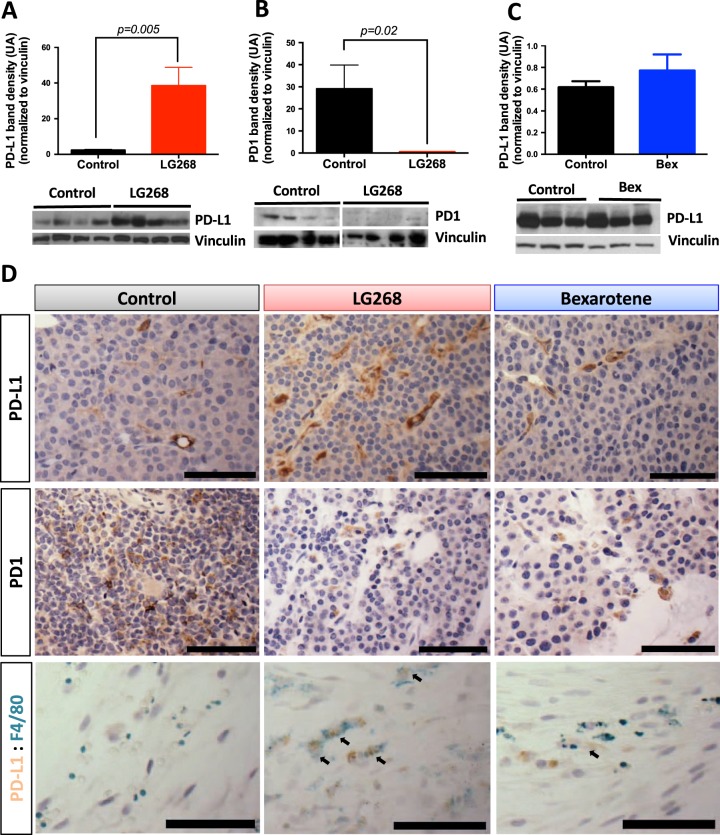
Fig. 6.
LG268 increases PD-L1 protein expression in tumors. a MMTV-Neu mice were treated with control diet or rexinoids (100 mg/kg diet). Levels of PD-L1 (t = 3.558; df = 10) (a and c) and PD-1 (t = 2.662; df = 10) b were analyzed by western blot in tumor lysates. Quantification of total protein levels in all samples (n = 11/group) is shown in the bar graphs, and western blots of representative samples are shown. d Immunohistochemistry was used to stain tumor sections for PD-L1 and PD-1, and dual immunohistochemical staining was used to stain tumor sections for PD-L1 and F4/80 (macrophages). Scale bar represents 60 μm. n = 5–11, Bars represent average and error bars the standard error of the mean (SEM)

