Fig. 7.
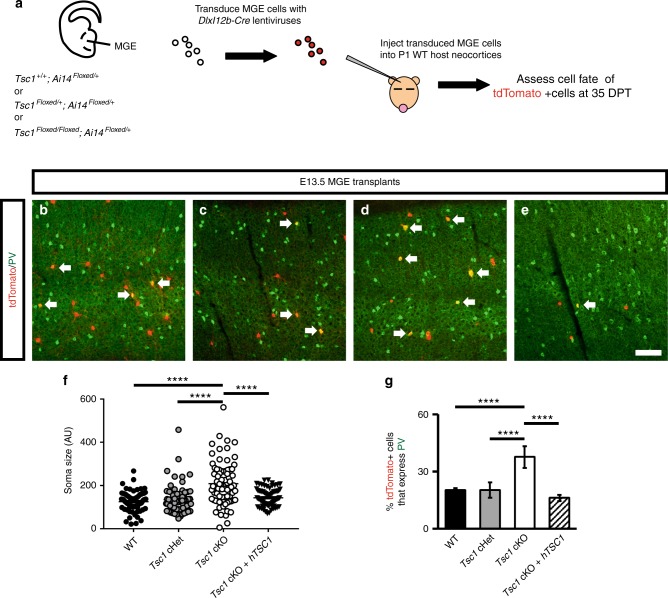
Cell autonomous increase in PV expression in Tsc1 null MGE-derived CINs. a Schema depicting the transplantation procedure. E13.5 Ai14Floxed/+ MGE cells (tdTomato+) that were either Tsc1+/+, Tsc1Floxed/+ or Tsc1Floxed/Floxed were transduced with a DlxI12b-Cre lentivirus, transplanted into WT P1 neocortices, then developed for 35 days post-transplant (DPT). Coronal immunofluorescent images of neocortices transplanted with Tsc1+/+ (WT), Tsc1Floxed/+ (cHet) or Tsc1Floxed/Floxed (cKO) MGE cells show co-expression of tdTomato and PV (b–d). In addition, human TSC1 was expressed in Tsc1Floxed/Floxed (cKO) MGE cells and assessed in the same manner (e). Arrows point to co-expressing cells. Quantification of soma size of the tdTomato+ cells (f): One-way ANOVA, (F3, 296 = 24.1, P < 0.0001; cKO vs. all groups, p < 0.0001), n = 3 mice (25 cells counted from each). (AU) arbitrary units. Quantification of the proportion of tdTomato+ cells that express PV (g): Chi-squared test with Yate’s correction, (cKO vs. all groups, p < 0.0001), n = 3, all groups (330 WT, 821 cHet, 913 cKO and 317 cKO/hTSC1 cells counted). Data are represented as mean ± SD in (f) and ± SEM in (g). Scale bar in (e) = 100 µm. ****p < 0.0001. Source data are provided as a Source Data file

