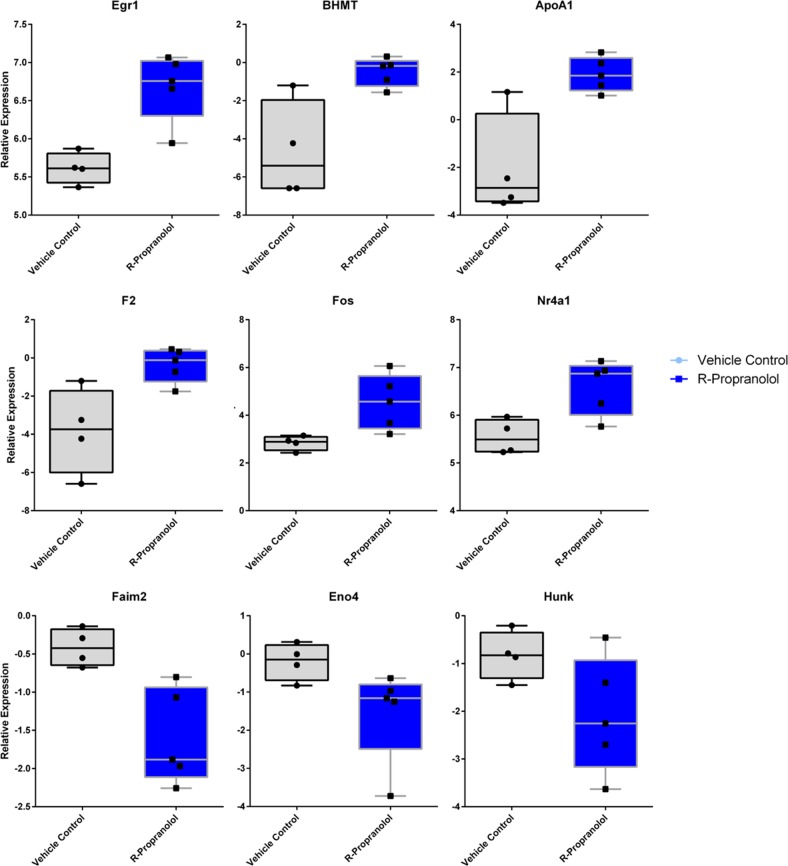
Fig. 7.
Selection of box plots of differentially expressed RNA transcripts of bEnd.3 cells treated with R-propranolol. Seven transcripts were found to be significantly downregulated, and 17 transcripts were upregulated. Six of the upregulated genes of interest including Egr1, APOA1, and BHMT as well as three of the downregulated genes including Faim2, Hunk, and Eno4 are included for representation. Box plots represent interquartile range with the central line denoting the median, and upper and lower whiskers represent standard error of means. Individual data points are included to demonstrate the spread

