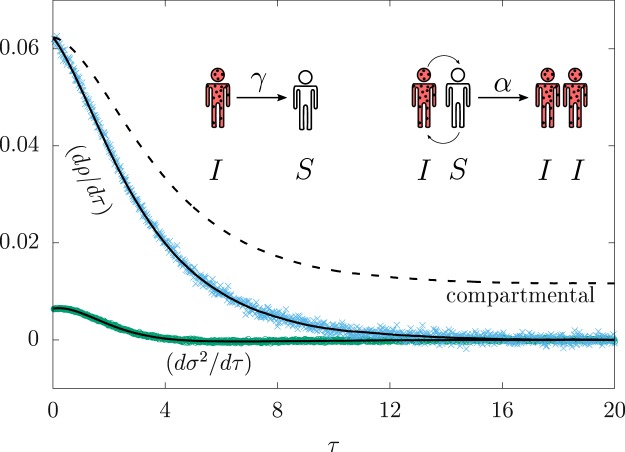
Figure 1.
Numerical simulations of the SIS model. (inset) Infected hosts (I) recover to susceptible state (S) with rate γ (left). The adequate interaction between an infected host with a susceptible one may trigger a new infection, with rate α (right). Stochastic effects are far more relevant for small population sizes (N = 50, γ/α = 1/2), reducing the accuracy of compartmental equations. The forward-derivative dρ/dτ from data (cross) agrees with Eq. (5a) (solid line), while the compartmental equation Eq. (1) fails to reproduce the data (dashed line). The forward-derivative dσ2/dτ from data (circles) also agrees with the formula in Eq. (5b) (line). All the lines are drawn using the simulated data for 〈ρ(τ)〉, σ2(τ), and Δ3(τ).

