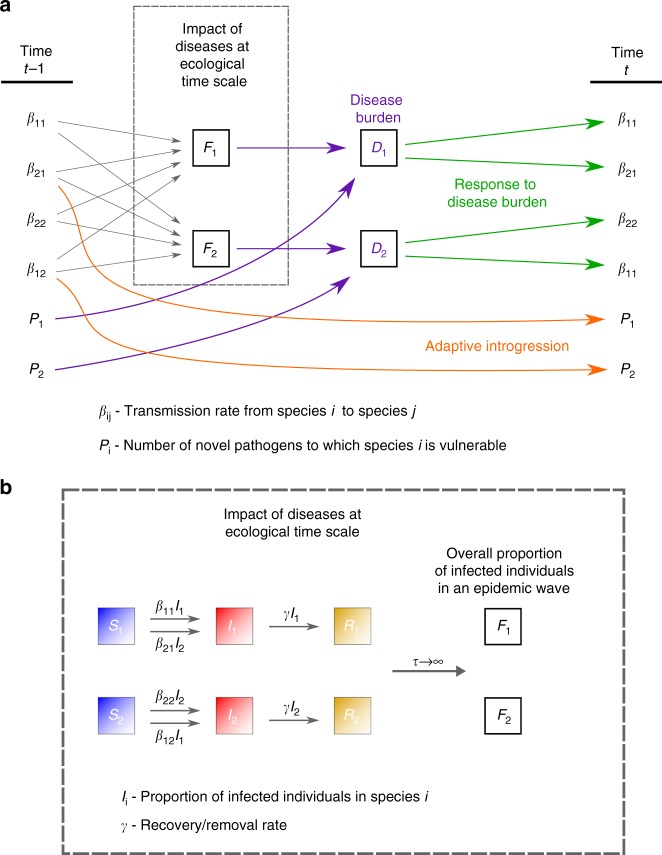
Fig. 2.
Schematic representation of the two-time-scales model. The model describes disease and introgression dynamics between two species. The figure shows the transition between two time steps at the evolutionary time scale, and . a Transmission rates (, within-species transmission; , between-species transmission from species to species ) determine the average impact of pathogens at the ecological time scale, according to Eqs. (3)-(9). The pathogen package size and the average impact of each pathogen determine the disease burden (purple), according to Eqs. (1) and (2). The species respond to disease burden by adjusting contact rates (green), according to Eqs. (10)–(13). Inter-species contact results in gene flow and adaptive introgression, reducing pathogen package sizes (orange), according to Eqs. (14) and (15). b Impact at the ecological time scale (dashed box in a) is modeled in an SIR epidemic framework, as the average impact of an epidemic. Individuals transition from state S (susceptible) to state I (infectious) from either within-species infections or between-species infections (Eqs. (3)–(8)). Individuals in state I transition to state R (recovered/removed) at rate (Eqs. (3)–(8)). The impact of an epidemic is measured as the overall proportion of individuals in species infected throughout the run of the epidemic (9)

