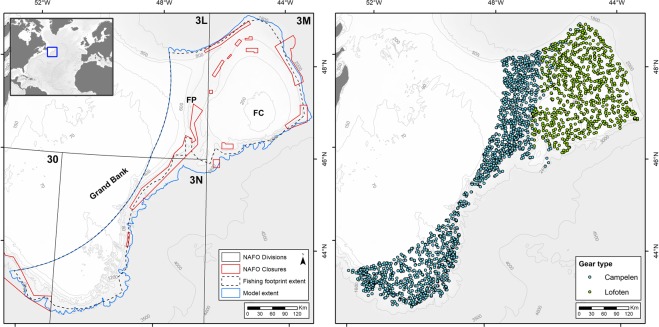
Figure 1.
Location of the study area (left) that includes the Flemish Cap (FC), Flemish Pass (FP) and Grand Bank. NAFO statistical divisions (3 LMNO), NAFO fishing footprint area, the area of the distribution model and the NAFO areas closed to protect vulnerable marine ecosystems50 are indicated. Location of the groundfish surveys (2006–2010) conducted with two distinct trawl gear types that were used to estimate total sponge biomass (right). Maps were produced in ArcMap 10.2.2 software46.

