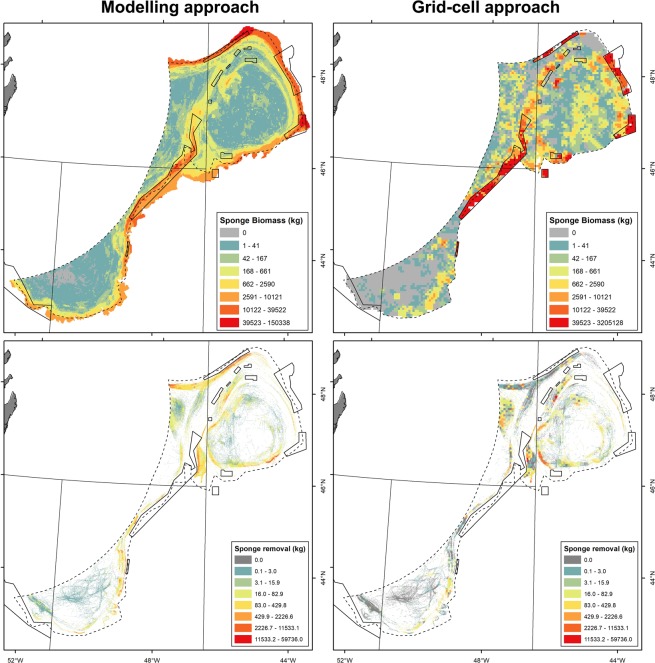
Figure 2.
Total sponge biomass in wet weight based on biomass model (R2 = 0.40 ± 0.03) (top left) and the grid-cell (top right) approaches. The respective removal estimates by the fishing fleet operating in the Flemish Cap area between 2010 and 2012 are given in the bottom panels. Empty cells in the top right map indicate areas where no data were available to estimate sponge biomass for the grid cell. Zero values indicate areas where the mean biomass was zero (i.e., no catch of sponge). Dotted line indicates the NAFO fishing footprint. Maps were produced in ArcMap 10.2.2 software46.

