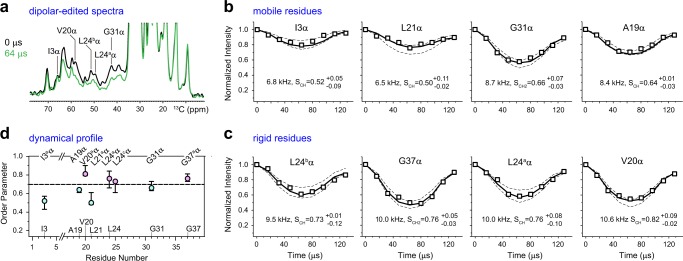
Fig. 4.
Mobility of hBD-3 analog in POPC/POPG bilayers at 269 K. a 1D 13C control, equilibrium spectrum (black) compared with a 64-µs dipolar-dephased spectrum (green), with signals from the rigid components dephased. 13C−1H dipolar couplings curves are categorized as b, mobile and c, rigid residues. The best-fit dipolar couplings, the corresponding order parameters, and error bars are labeled. d C–H order parameters of membrane-bound peptides. The relatively rigid residues are highlighted in magenta and the mobile residues are in cyan. Error bars represent the well-fit order parameters obtained from panels b and c. Dashline indicates the order parameter of 0.7

