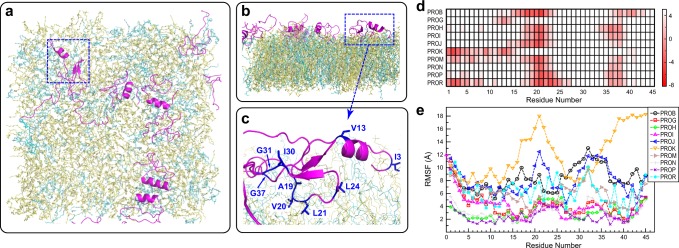
Fig. 6.
MD simulation reveals the insertion pattern of hBD-3 analog in POPC/G bilayers. a The topview and b, sideview of the last structure of hBD-3 analogs (magenta) in POPC/G from Anton Simulation. Water and ions are not shown. POPC and POPG lipids are in yellow and cyan, respectively. c Zoomed-in view of hBD-3 analog insertion through its loop regions. d Insertion depth matrix for ten peptides in POPC/G lipid bilayers. Residues 18–24 and 36–40 have deep insertion conserved in different peptides. e RMSF of hBD-3 analog binding POPC/G bilayers based on 5.0 µs Anton simulation trajectory

