Figure 3.
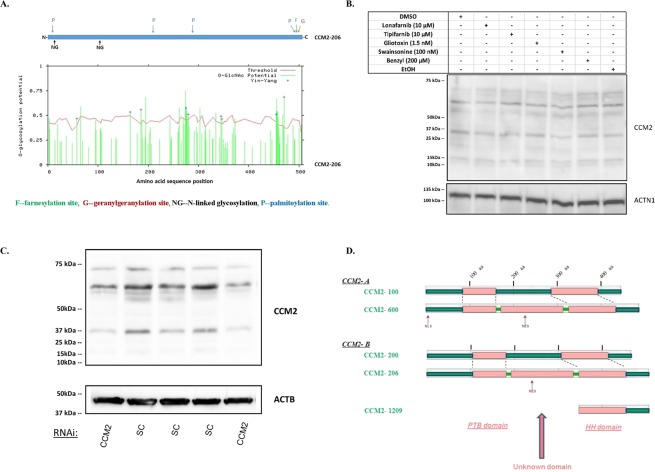
Cellular distribution and motifs/domains among different endogenous CCM2 isoform proteins. (A) the potential post-translation modification (PTM) sites were defined with prediction software by searching the longest CCM2 isoform, CCM2-206. In the upper panel, CSS (clustering and scoring strategy) was used to scan palmitoylation sites (P), farnesylation sites (F), and geranylgeranylation sites (G) while NetNGlyc 1.0 was used to predict N-glycosylation sites (NG). In the lower panel, YinOYang 1.2 was used to predict O-glycosylation sites: green bars surpassing the red threshold line have significant chance to be glycosylated at the site through O-glycosylation. Each major PTM is color coded. (B) Multiple CCM2 protein bands are not a result of post-translation modifications. Two different vehicle-controls (DMSO, EtOH), inhibitors of farnesylation (Lonafarnib, Tipifarnib, Gliotoxin) and geranylgeranylation (GGTI-298), N-linked glycosylation inhibitor (Swainsonine), and O-linked glycosylation inhibitor (benzyl-α-GalNAc, Benzyl) were used to treat 293 T cells. None of the treatments resulted in missing bands or significantly changed band density, comparable to the controls. (C) Multiple CCM2 protein bands are diminished by silencing CCM2. 293 T cells were treated with either CCM2 RNAi (siRNA-CCM2) or scrambled control (SC). Significantly decreased densities of all protein bands of CCM2 were observed consistently (two shown) in CCM2 knockdown cells, relative to SC controls. (D) Bioinformatics analysis of potential functional domains and putative linear motifs in CCM2 isoforms. (D1). Two longest isoform pairs of CCM2 from A group (100 and 600) and B group (200 and 206) were selected, to screen for intrinsic globularity with GlobPLot 2.3 and putative linear motifs with ELM, (Eukaryotic linear motifs). Structurally globular regions are considered to be composed of different secondary structures and fold types (pink), in contrast to disorder (unstructured) regions (green). All isoforms of CCM2 from A group and B group share two common globular regions: N-terminal globular region which harbors PTB domain and C-terminal region which covers HH domain (Harmonin homology). Intriguingly, a third globular region was identified, by analyzing two longest isoforms of CCM2, which have an additional newly identified 41 amino acid (aa) peptide coded by exon 6A (CCM2-600 and CCM2-206), compared to their respective paired isoforms, CCM2-100 (A) and CCM2-200 (B). The appearance of a new middle globular region might suggest an additional secondary structure and fold created in conjunction with this additional peptide. (D2). With motif prediction tool, ELM, we found five major linear protein motifs along CCM2 isoforms. (D2.1). Motif for protein degradation (red colored). 11, signal motif targeting to endoplasmic reticulum (ER) lumen; 12, signal motif targeting the protein for degradation in a cell cycle dependent manner; 13, signal motif targeting the protein for degradation by binding to the UBR-box of N-recognins; 14, S/T rich motif for SPOP/Cul3-dependant ubiquitination; 15, a degron motif, for the cyclin’s degradation; 16, LIR motif in autophagy; 17, di-Arg ER retention motif, targeting to endoplasmic reticulum (ER) lumen; 18, Sorting motif, targeting to the lysosomal-endosomal-complex. (D2.2). Motif for protein phosphorylation (pink colored). 21, canonical motif for the CDK phosphorylation site; 22, canonical motif for MAP kinases docking or phosphorylation site; 23, CK1 phosphorylation site; 24, GSK3 phosphorylation recognition site. (D2.3). Motif for proteinase cleavage (dark blue colored). 31, canonical motif for proteinase cleavage site. (D2.4). Motif for protein-protein binding (light blue colored). 41, Docking motif in calcineurin; 42, USP7 MATH domain binding motif; 43, USP7 CTD domain binding motif; 44, WW domain interaction motif. (D2.5). Motif for nucleocytoplasmic shuttling (brown colored). NLS, nuclear localization signals; NES, nuclear export signals. Most of the predicted motifs for two pairs are identical, except a few motifs which are located at the beginning of transcript (exon 1 for A group, exon 1A for B group).

