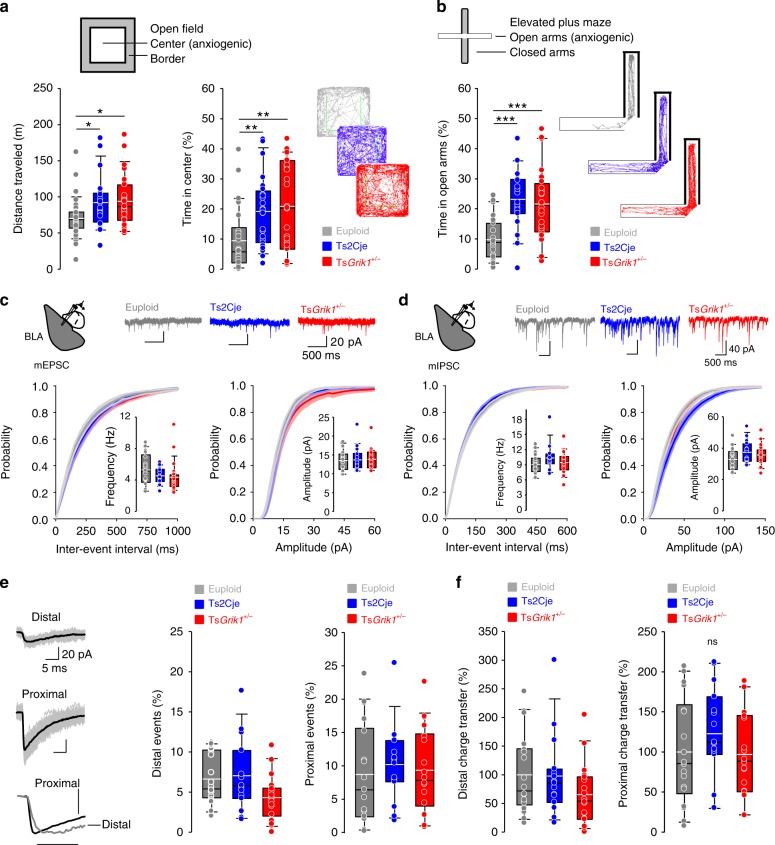
Fig. 5.
Anxiety and fear phenotypes are independent of Grik1 triplication in Ts2Cje mice. a Top, schematic representation of the open field arena and the areas considered border (shaded) and center (light). Bottom, box plot showing quantification of distance traveled (left) and time in center (right) as well as representative mice tracks in the arena. Ts2Cje and TsGrik1+/− mice showed increased distance traveled and time in center of the arena, indicating hyperlocomotion and reduced anxiety (n = 35 for euploid, n = 24 for Ts2Cje, n = 27 for TsGrik1+/−, ANOVA on ranks+Dunn’s). b Top, schematic representation of the elevated plus maze, with two open (light) and two closed (shaded) arms. Bottom, box plot showing quantification of time spent in open arms and representative mice tracks in the maze. Ts2Cje and TsGrik1+/− mice spent increased time in the open arms, indicating reduced anxiety (n = 23 for euploid, n = 19 for Ts2Cje, n = 24 for TsGrik1+/−, one-way ANOVA+Holm–Sidak). c Basal excitatory synaptic transmission (mEPSCs) recorded at −75 mV in basolateral amygdala (BLA) neurons. Top, schematic representation of the area recorded and representative traces of mEPSCs. Bottom, cumulative distribution and box plots showing unaltered mEPSC frequency (left) and amplitude (right) in Ts2Cje and TsGrik1+/− mice (n = 21 for euploid, n = 18 for Ts2Cje, n = 24 for TsGrik1+/−, ANOVA on ranks). d Basal inhibitory transmission (mIPSCs) recorded at −60 mV in BLA neurons. Top, schematic representation of recorded area and representative traces of mIPSCs. Bottom, cumulative probability and box plots showing unaltered frequency (left) and amplitude (right) of mIPSCs recorded in Ts2Cje mice (n = 18 for euploid, n = 15 for Ts2Cje, n = 18 for TsGrik1+/−). e Left, representative traces of distal (top), proximal (middle), and normalized (bottom) mIPSCs recorded in BLA neurons. Box plots showing quantification of proportion of distal (center) and proximal (right) mIPSCs (n = 18 for euploid, n = 15 for Ts2Cje, n = 18 for TsGrik1+/−, one-way ANOVA in distal mIPSCs, ANOVA on ranks in proximal mIPSCs). f Box plots representing the charge carried by distal (left) and proximal (right) mIPSCs in BLA neurons (n = 18 for euploid, n = 15 for Ts2Cje, n = 18 for TsGrik1+/−, ANOVA on ranks in distal mIPSCs, one-way ANOVA in proximal mIPSCs). For detailed data values and statistics, see Supplementary Table 5. *p < 0.05, **p < 0.01, ***p < 0.005

