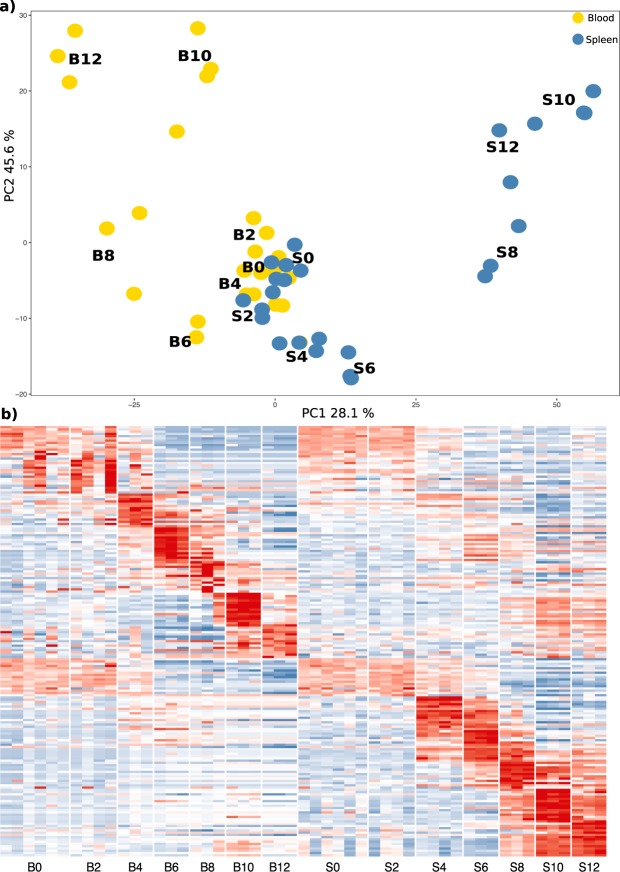
Figure 1.
Merged expression matrix analysis shows distinct transcriptional patterns in blood and spleen over the course of acute P. chabaudi infection. (a) Principal component analysis of gene expression values from blood (yellow) and spleen (blue). (b) Gene expression signatures between the two tissues (B = blood, S = spleen) in the time-series composed of the top 10 significant differentially expressed genes (power > 0.7; −1.5 < logFC > 1.5) from the merged expression matrix. Colour scale represents expression value Z scores.

