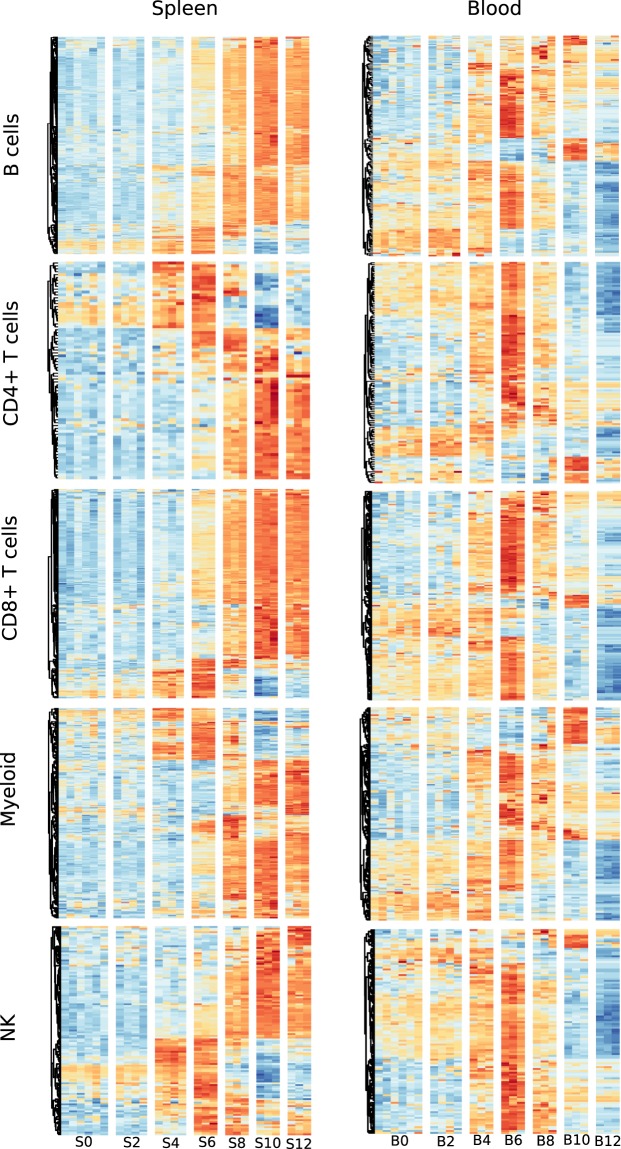
Figure 6.
Comparison of cell-specific transcriptional signatures in blood and spleen over the course of infection. Differentially expressed genes (DEG) associated with five major cell types were visualised using heatmaps of their expression Z-scores (blue = −3, yellow = 0, red = +3). DEG from each tissue, irrespective of their time allocation were scanned against the ImmGen Phase 1 microarray signature and those with a match were used to build a heatmap and display temporal expression patterns.

