Fig. 1.
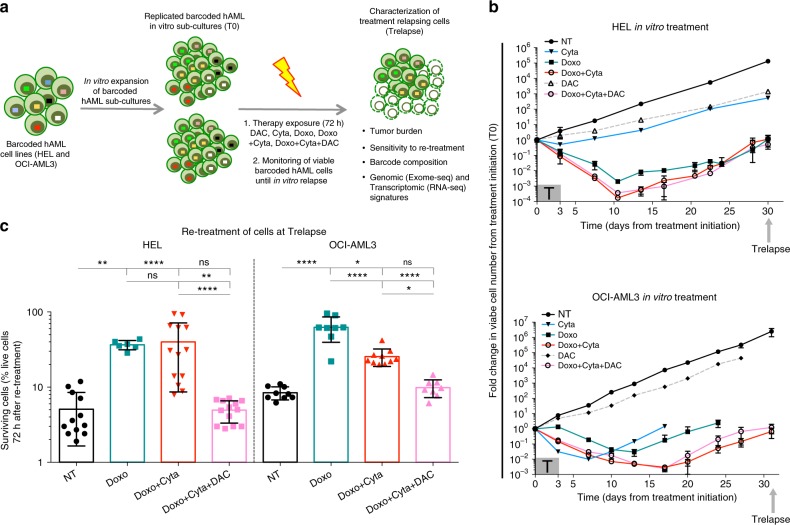
Chemotherapy + Decitabine combination prevents chemoresistance in hAML cells. a Schematic diagram of the experimental system used. T0 indicates the time of treatment initiation and Trelapse is defined as the post-therapy time point when re-grown hAML reached equivalent numbers as T0. NT–no treatment; DAC–decitabine (0.1 μM); Doxo–doxorubicin (1.8 μM); Cyta–cytarabine (6μM). b Total number of viable HEL and OCI-AML3 barcoded cells between T0 and Trelapse, defined as a fold variation of cell number at each measured time point relatively to T0 (n = 3 for NT and DAC, n = 5 for Cyta and Doxo, n = 8 for Doxo + Cyta and Doxo + Cyta + DAC, independent replicates). T box indicates the period of therapy exposure. c Frequency of viable Trelapse HEL and OCI-AML3 barcoded cells (NT: n = 12/9, Doxo: n = 6/8, Doxo + Cyta: 13/10 and Doxo + Cyta + DAC: 13/8, independent replicates in HEL / OCI-AML3 respectively) after re-exposure to Doxo + Cyta for 72 h. Concerning panels b and c displayed graphs show mean ± s.d.; P values were determined by one-way ANOVA test. ns–not significant, *P < 0.05; **P < 0.01; ***P < 0.001; ****P < 0.0001. Source data are provided as a Source Data file

