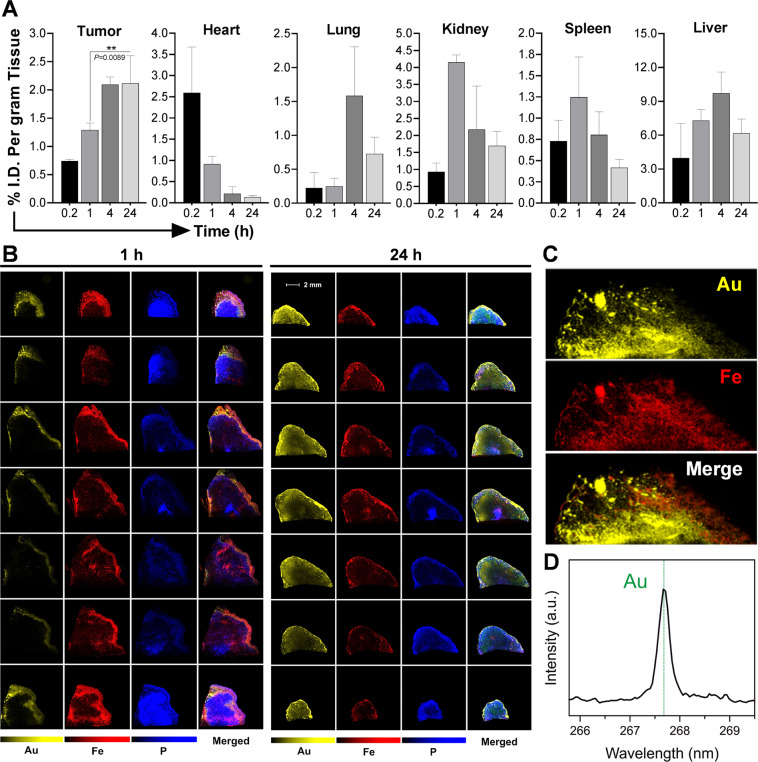
Figure 3.
Biodistribution and tumor localization studies. (A) Quantitative biodistribution of t-NP in tumor and various organs were measured by ICP-MS following its i.v.-administration in Capan1 tumor-bearing mice (n = 5). At 24 h, maximum tumor accumulation was noticed with comparably less accumulation in other vital organs. (B) Laser-induced breakdown spectroscopy imaging was performed to qualitatively estimate the intratumoral distribution of t-NP. The symbols correspond to, Au – Gold (indicative of t-NP), Fe – Iron (a surrogate marker for tumor blood vessels) and P – Phosphorus. The presence of Au from t-NP and Fe from the heme of RBCs conveyed specific imaging signals. A complete tumor analysis from tumor periphery to the core demonstrate heterogeneous distribution of nanoparticles. 24 h tumor samples exhibit maximum t-NP distribution, and Au was observed in close proximity to the tumor blood vessel signal (red). (C) High-magnification LIBS imaging revealed substantial overlap of Au and Fe in a 24 h tumor sample. (D) Real-time spectral analysis demonstrated a corresponding peak for Au (yellow) at 267.595 nm and confirmed its intratumoral accumulation in an h-PDAC tumor model.

