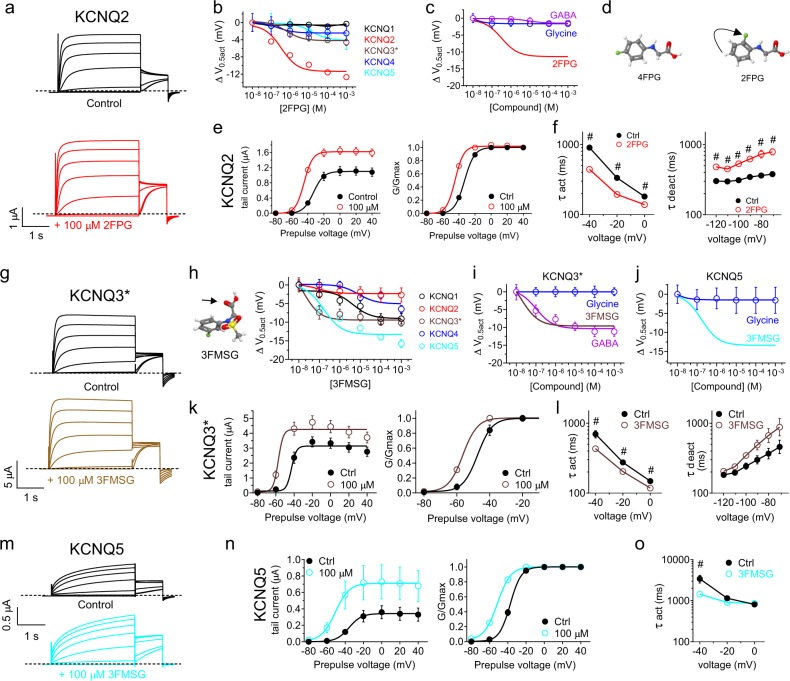
Fig. 4.
KCNQ isoform-specific activation by fluorinated glycine derivatives. All error bars indicate SEM. a Mean traces showing effects of 2FPG (100 µM) on KCNQ2 (n = 5). b 2FPG dose responses for homomeric KCNQ1, 2, 3*, 4, and 5, quantified as shift in the voltage dependence of channel activation (ΔV0.5act) calculated from the tail current using recordings as in panel (a); n = 5. c 2FPG dose response for KCNQ2 compared to those of glycine and GABA, quantified as current fold-change at −60 mV; n = 5–6. d Comparison of 4FPG and 2FPG structures showing the change in fluorine position (arrow). e Effects of 2FPG (100 µM) on KCNQ2 raw tail currents and normalized tail current (G/Gmax); n = 5. f Effects of 2FPG (100 µM) on KCNQ2 activation and deactivation rates, fitted as a single exponential function (τ); n = 5. # P < 0.01. g Mean traces showing effects of 3FMSG (100 µM) on KCNQ3* (n = 7). h 3FMSG (glycine carbonyl highlighted with arrow) dose responses for homomeric KCNQ1, 2, 3*, 4, and 5 channels quantified as ΔV0.5act measured from the tail currents from traces as in (g); n = 4–7. i 3FMSG dose response for KCNQ3* compared to those of glycine and GABA, quantified as ΔV0.5act; n = 5–7. j 3FMSG dose response for KCNQ5 compared to that of glycine, quantified as current fold-change at −60 mV; n = 4–5. k Effects of 3FMSG (100 µM) on KCNQ3* raw tail current and normalized tail current (G/Gmax); n = 7. l Effects of 3FMSG (100 µM) on KCNQ3* activation and deactivation rates, fitted as a single exponential function (τ); n = 7. m Mean traces showing effects of 3FMSG (100 µM) on KCNQ5 (n = 5). n Effects of 3FMSG (100 µM) on KCNQ5 raw tail currents and normalized tail current (G/Gmax) measured from traces as in panel m; n = 5. o Effects of 3FMSG (100 µM) on KCNQ5 activation rate, fitted as a single exponential function (τ); n = 5. # P < 0.05

