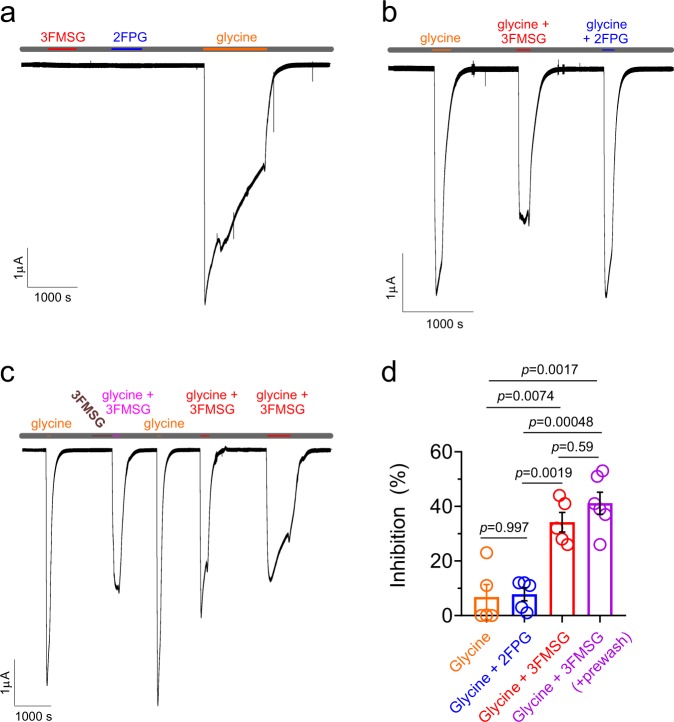
Fig. 5.
Differential effects on GLRA1 activity of 2FPG and 3FMSG. All error bars indicate SEM. a Exemplar trace showing lack of effects of 3FMSG or 2FPG alone on GLRA1 activty, compared to robust activation by glycine alone (all compounds applied at 1 mM), application indicated by colored bars at top. Gray, application of bath solution alone. b Exemplar trace showing inhibition of glycine-activated GLRA1 by 3FMSG (100 µM) but not 2FPG (100 µM) (glycine applied at 1 mM in each case), application indicated by colored bars at top. Gray, application of bath solution alone. c Exemplar trace showing inhibition of glycine-activated GLRA1 by 3FMSG (100 µM) with versus without 3FMSG (100 µM) pre-wash in (glycine applied at 1 mM in each case), application indicated by colored bars at top. Gray, application of bath solution alone. d Mean inhibition of 1 mM glycine-activated GLRA1 current by 2FPG or 3FMSG (100 µM) with/without 3FMSG (100 µM) pre-wash, n = 5–6, from traces as in panels (b) and (c). Currents were compared to an initial current activated by glycine alone; as a control, glycine-activated current in a subsequent wash-in was compared to the initial glycine wash-in current (orange), showing negligible inhibition as expected

