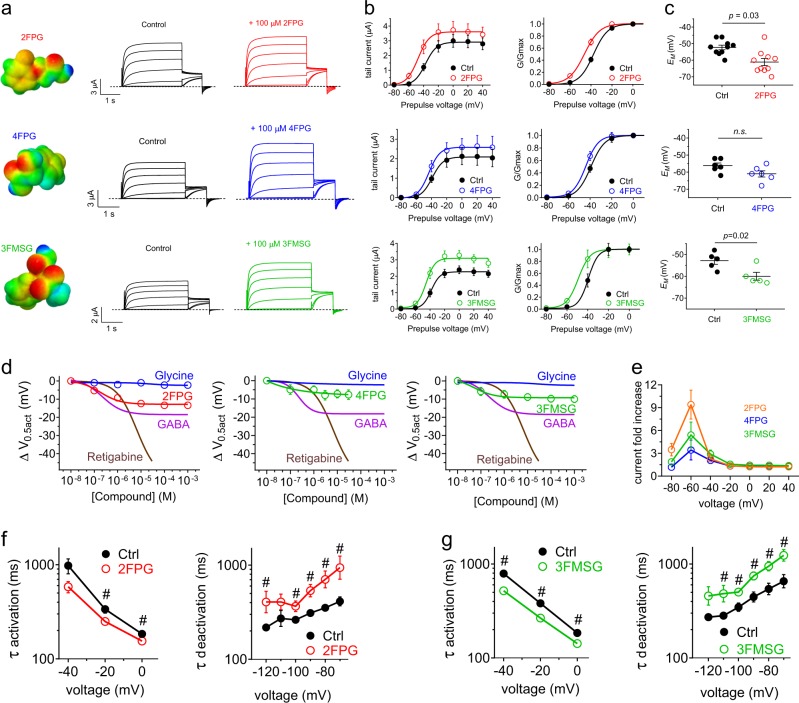
Fig. 6.
Differential effects on KCNQ2/3 activity of fluorinated glycine derivatives.All error bars indicate SEM. a Jmol surface plot of compounds indicated, showing electrostatic surface potential (red, negative; blue, positive) and corresponding mean TEVC traces for KCNQ2/3 expressed in Xenopus oocytes in the absence (control) or presence of compounds as glycine derivatives as indicated (n = 4–6). Dashed lines indicated zero current level. b Mean tail current and normalized tail currents (G/Gmax) versus prepulse voltage relationships recorded by TEVC in Xenopus oocytes expressing KCNQ2/3 channels in the absence (black) or presence (red, blue, green) of glycine derivatives indicated (100 µM) (n = 4–6). c Effects of glycine derivatives (100 µM) on resting membrane potential (EM) of unclamped oocytes expressing KCNQ2/3 (n = 4–6). d 2FPG, 4FPG and 3FMSG dose responses for KCNQ2/3 compared to those of glycine, GABA and retigabine, quantified as shift in voltage dependence of activation (ΔV0.5act); n = 4–6. e Comparison of 2FPG, 4FPG and 3FMSG (100 µM) effects quantified as KCNQ2/3 current fold-increase versus membrane potential; n = 4–6. f Effects of 2FPG (100 µM) on KCNQ2/3 activation and deactivation rates, fitted as a single exponential function (τ); n = 15. # P < 0.05 between values at equivalent membrane potential. g Effects of 3FMSG (100 µM) on KCNQ2/3 activation and deactivation rates, fitted as a single exponential function (τ); n = 10. # P < 0.05 between values at equivalent membrane potential

