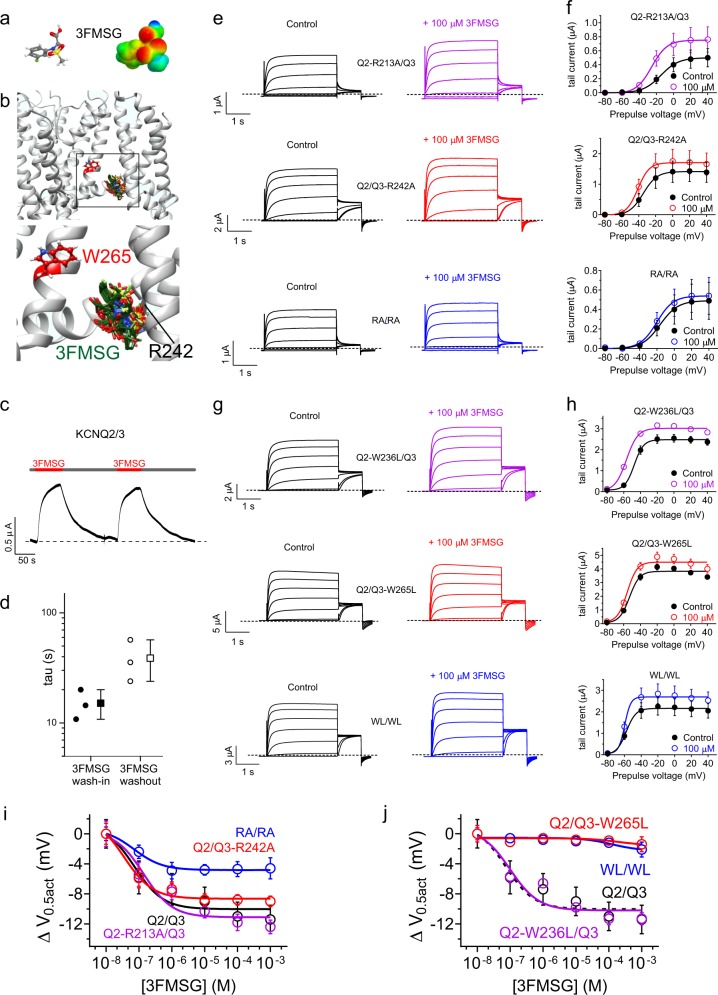
Fig. 8.
3FMSG activation of KCNQ2/3 requires KCNQ3 R242 and W265. All error bars indicate SEM. a 3FMSG structure and electrostatic surface potential map. b SwissDock result showing predicted binding of 3FMSG to a chimeric KCNQ1-KCNQ3 model, with close-up of boxed region. c Representative trace showing effects at −60 mV on KCNQ2/3 current expressed in oocytes during wash-in and washout of 100 µM 3FMSG. d Mean time course of current increase and decrease during wash-in and washout respectively of 3FMSG (100 µM) expressed as the tau of a single exponential function, quantified from traces as in panel (c), n = 3 oocytes (two wash-in/out cycles per oocyte, values averaged for each oocyte). e, f Mean traces (e) and tail current-voltage relationships (f) for wild-type and arginine-mutant KCNQ2/3 channels traces as indicated in the absence (Ctrl) or presence of 100 µM 3FMSG. RA/RA, KCNQ2-R213A/KCNQ3-R242A; n = 5–6. g, h Mean traces (g) and tail current-voltage relationships (h) for wild-type and tryptophan-mutant KCNQ2/3 channels traces as indicated in the absence (Control) or presence of 100 µM 3FMSG. WL/WL, KCNQ2-W236L/KCNQ3-W265L; n = 5–6. i 3FMSG dose responses of wild-type and arginine-mutant KCNQ2/3 channels as in (e, f), quantified as shift in voltage dependence of activation (ΔV0.5act); n = 5-6. j 3FMSG dose responses of wild-type and tryptophan -mutant KCNQ2/3 channels as in (g, h), quantified as shift in voltage dependence of activation (ΔV0.5act); n = 5-6

