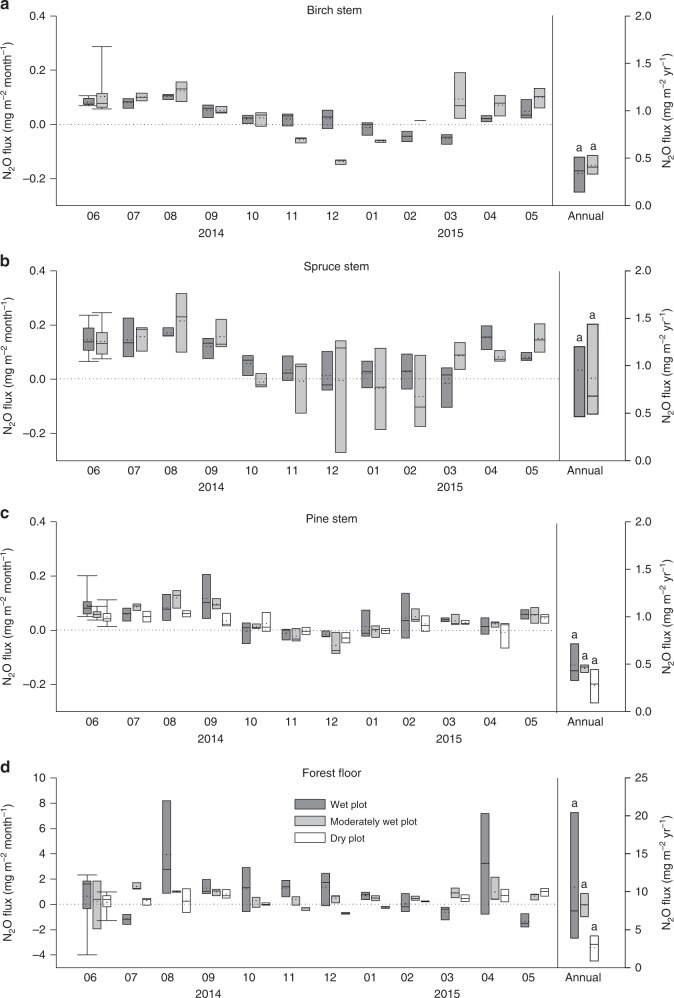
Fig. 1.
Stem and forest floor N2O fluxes. Seasonal courses of monthly N2O fluxes (mg m−2 month−1) and total annual N2O fluxes (mg m−2 yr−1) from stems of birch (a), spruce (b), and pine (c), and from forest floor (d) measured from June 2014 to May 2015. Positive fluxes indicate N2O emission, negative fluxes N2O uptake. The solid line within each box marks the median value, broken line the mean, box boundaries the 25th and 75th percentiles, and whiskers the 10th and 90th percentiles. Statistically significant differences among annual fluxes at p < 0.05 are indicated by different letters above bars. Mean annual volumetric water contents (± standard error) of the plots were as follow: wet plot, 0.81 ± 0.02 m3 m−3; moderately wet plot, 0.40 ± 0.02 m3 m−3; and dry plot, 0.21 ± 0.01 m3 m−3. The dry plot did not have spruce or birch trees. Stem fluxes were measured from three trees per species at each plot (n = 3). Forest floor fluxes were measured at three positions at the wet and moderately wet plots (n = 3) and at six positions at the dry plot (n = 6). Annual fluxes were calculated as the sums of 12 monthly fluxes

