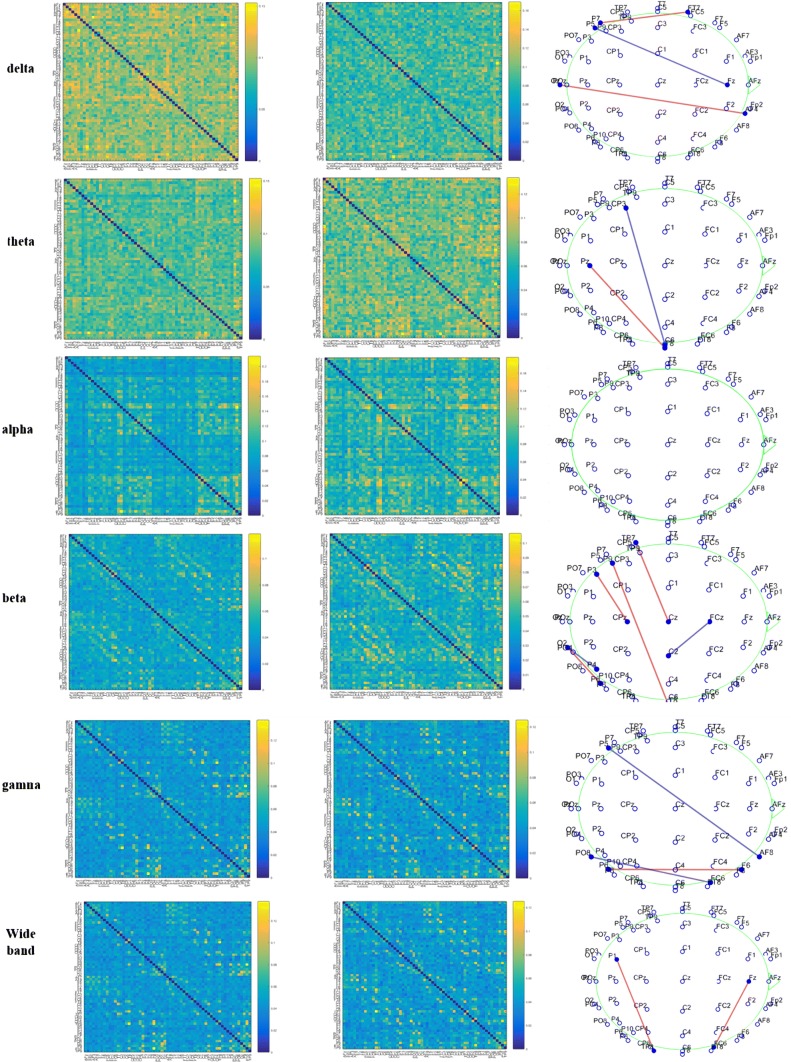
Fig. 2.
Functional connectivity matrixes of MDIs (left column) and NCs (middle column) in the delta, theta, alpha, beta, gamma and wide (1–45 Hz) frequency bands. Significant pairwise connectivity differences after FDR correction on EEG sensor space (right column). Blue color means connectivity value of MDIs > NCs and red means NCs < MDIs

