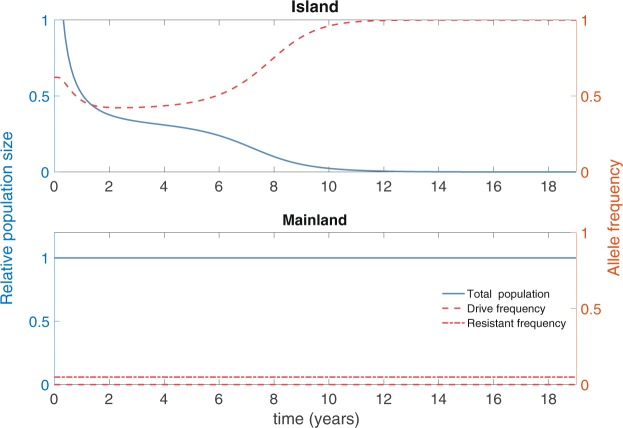
Figure 2.
Island and mainland population dynamics (blue curves) and genetics (red curves) in the invasion threshold scenario (s = 0.8 and h = 0.8), following an above-threshold release of drive individuals on the island (1650 drive homozygotes released at t = 0; release ratio 1.65:1). Left axis (blue) denotes population size relative to pre-release equilibrium, right axis (red) denotes allele frequency. The drive spreads on the island (dashed red curve shows allele frequency for drive), suppressing its population (solid blue curve shows relative population size). Migration from the mainland to the island (at baseline, on average one island individual travels to the mainland a month) leads to a low drive frequency on the mainland that does not exceed the invasion threshold there. Consequently, the mainland population is largely unaffected. (Dot-dashed line denotes frequency of resistance allele. Note that the target allele being fixed means that the resistant allele is not present on the island).

