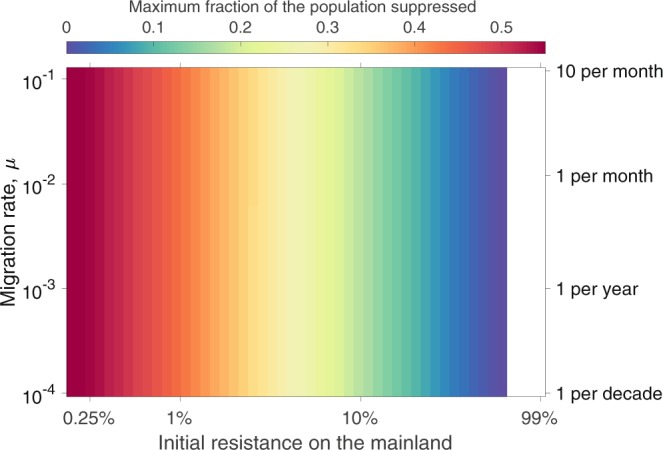
Figure 4.

Maximum level of transient suppression seen on the mainland following an island release of 100 homozygous drive individuals in the no invasion threshold scenario (s = 0.8 and h = 0.3) across combinations of different migration rates and initial frequencies of resistant alleles on the mainland. Different levels of suppression are denoted by different colors (see color key on figure). Low initial resistance frequencies depict pessimistic scenarios (mainland is almost entirely susceptible to the drive), while high initial resistance frequencies approach the private allele scenario discussed in the text. The white region of the figure denotes initial levels of resistance that exceed the threshold level above which drive cannot invade the mainland.
